Top 10 trading strategies that everyone should know
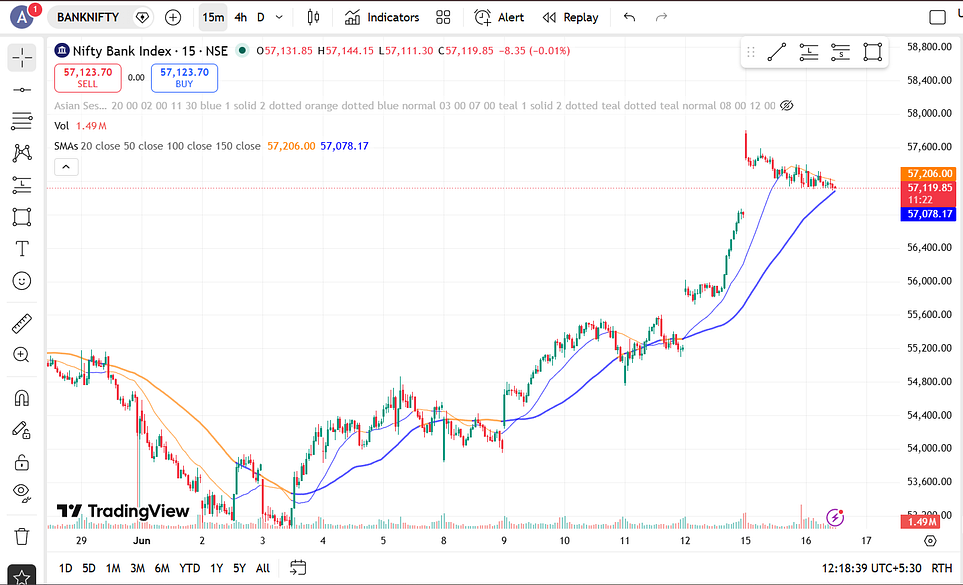
This will save years of time for beginners.
The ranking of this strategies is based on personal experience and complexity of the strategies gets higher as we move along. That means it will take more time to master the higher ranking strategies.
If you find this insightful then please comment your views
10. Indicator Overload
When you first started trading, people would have suggested add “xyz” indicator to your chart and trade according to its breakout.
Lets say you added bunch of indicators to your chart like RSI, bollinger bands, MACD etc.
Think of price action like stretching a rubber band.
Bollinger Bands tell you how far the rubber band has stretched. Because the upper and lower bands are set two standard deviations away from a 20-period moving average, price stays inside these bands roughly 95% of the time. Touching a band means price is at a statistical extreme.
RSI tells you how much energy is left in the person stretching it. It measures the velocity and magnitude of price changes on a scale of 0 to 100.
Press enter or click to view image in full size
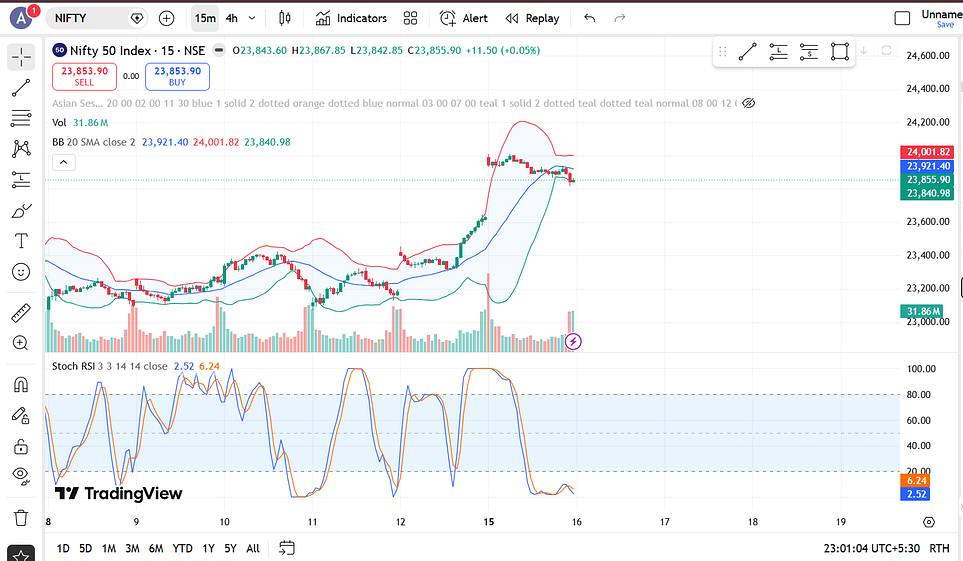
These are lagging indicators, which means the price moves first and then the indicators move according to it. This indicators deliver old information.
Logic —
1. The Bearish Setup (Shorting / Selling)
You are looking for an overextended market that is losing steam.
Price Action: A candlestick pushes up and touches or closes completely outside the Upper Bollinger Band. This indicates price is statistically expensive.
RSI Confirmation: At that exact same moment, the RSI must be above 70 (overbought).
The Execution: You enter a short position (or sell your holding) when ou see a bearish confirmation candle (like a shooting star or bearish engulfing pattern) falling back inside the upper band.
2. The Bullish Setup (Buying)
You are looking for a panicked market that is ready to bounce.
Price Action: A candlestick plummets and touches or pierces the Lower Bollinger Band. This indicates price is statistically cheap.
RSI Confirmation: Simultaneously, the RSI must be below 30 (oversold).
The Execution: You enter a long position when a bullish reversal candle closes back above the lower band.
In trading there are winners and there are losers. There might be people who make money out of this indicators but the time of this strategy is gone. market evolves and so does patterns and strategies.
9. Moving Average strategy
Moving average is yet another lagging indicator that means the price action moves first and then the indicator.
Why is it different category than rest of the indicators?
because the market respects the Moving averages but trading only on indicator is not a great strategy.
When market moves certain percent from the moving average indicator, it comes backs to that indicator at some point.
Press enter or click to view image in full size
20 day SMA and 50 day SMA
There are two types of Moving Averages I have used in my trading career —
EMA (Exponential Moving Average) and SMA (Simple Moving Average) are key technical analysis tools used to smooth price data and identify trends.
The core difference is sensitivity: the EMA reacts faster to recent price changes because it weights current data more heavily, while the SMA weights all periods equally, resulting in a smoother, less reactive line.
You can build your setup according to the moving average you are comfortable with.
Logic —
1. The Bullish Setup (Buying / Longing)
You are looking to buy an asset that is in a healthy uptrend, using the moving average as a moving floor.
Price Action: You plot a fast-moving EMA (like the 9 or 20 EMA) and a slow-moving EMA (like the 50 EMA). The fast EMA must cross above the slow EMA — a classic signal known as a “Golden Cross,” showing short-term momentum is shifting upward.
The Pullback: You do not buy blindly during the cross. You wait for the price to pull back and touch the EMA line, treating it as dynamic support.
The Execution: You enter a long position when you see a bullish rejection candle (like a pin bar or hammer) bouncing off the EMA line, proving buyers are defending that moving floor.
2. The Bearish Setup (Shorting / Selling)
You are looking to short an asset that is cascading downward, using the moving average as a moving ceiling.
Price Action: The fast EMA crosses below the slow EMA (a “Death Cross”), signaling that the immediate trend has turned aggressively bearish.
The Pullback: You wait patiently for a temporary relief rally where the price moves back up to test the downward-sloping EMA line from below.
The Execution: You enter a short position when a bearish candlestick gets rejected at the EMA line, confirming the moving ceiling is holding.
In trading, there are winners and there are losers. Moving averages work beautifully when the market is in a screaming, beautifully clean trend. But the minute the market goes sideways into a flat range, this strategy will chop your account to pieces. The moving average line will flatten out.
8. Trendlines
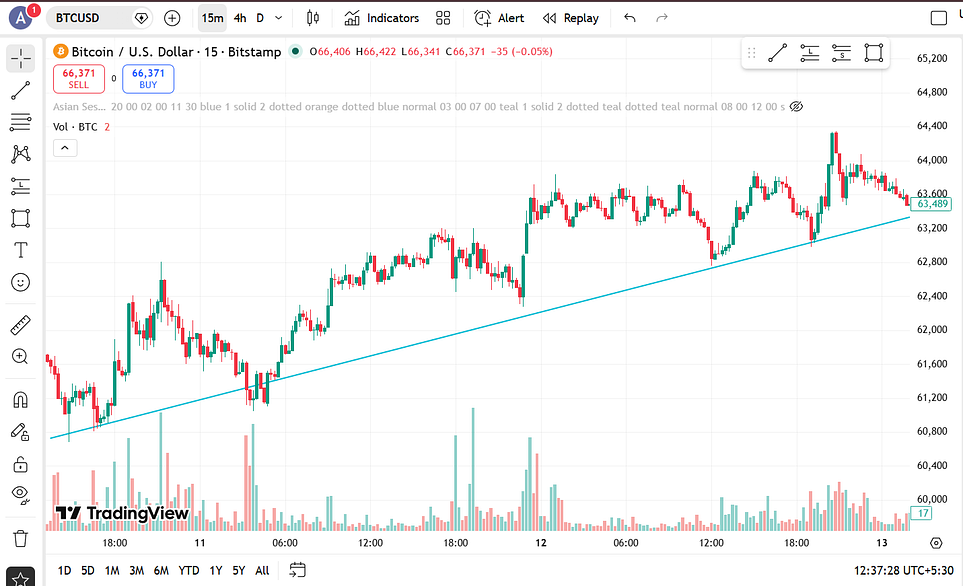
In my starting days, I used to mark trendlines and think them as a support/resistance.
Was I able to Trade with it? NO
Is it a working strategy? YES
Do people make profit out of this? YES
Trendline strategy are easy to learn and understand. Trading is about execution and psychology. So if you are confident with your setup, go ahead.
Press enter or click to view image in full size
Logic —
1. The Bullish Setup (Buying / Longing)
You are looking to buy a market that is structurally climbing, using a diagonal floor as your entry point.
Price Action: Connect at least two major higher lows on your chart with a rising diagonal line. Wait patiently for the market to pull back and approach this line for a third time.
The Confirmation: You do not just buy the exact touch of the line. You watch the candlestick behavior. You want to see the price pierce the line briefly but aggressively snap back above it, leaving a long wick at the bottom.
The Execution: You enter a long position immediately upon the close of that bullish rejection candle (like a hammer), using the trendline as your protective shield.
2. The Bearish Setup (Shorting / Selling)
You are looking to short a market that is structurally decaying, using a diagonal ceiling to time your entry.
Price Action: Connect at least two major lower highs with a descending diagonal line. Wait for the market to experience a temporary relief rally back up to this line.
The Confirmation: Look for the price to struggle as it hits the descending trendline, forming a bearish candlestick pattern that proves sellers are still active at this boundary.
The Execution: You enter a short position on the close of the bearish rejection candle, anticipating the next major leg down.
In trading, there are winners and there are losers. Trendlines give you a cleaner, more personalized view of the market structure, but they suffer from a massive flaw: subjectivity. If you put ten retail traders in a room and ask them to draw a trendline on the exact same chart, you will get ten completely different lines. Beginners often make the mistake(personal experience) of “forcing” trendlines — slanted at ridiculous angles just to justify a trade they already want to take
Simply speaking not everything that works for me will work for you and vice versa. You have to pick a strategy, make a logical setup around it, test it and after having a statistical edge you trade with it.
7. Support and Resistance strategies
Once you stop forcing diagonal trendlines at random angles, you notice something much cleaner: the market has a memory for specific horizontal price levels. This brings us to Support and Resistance — the absolute bedrock of traditional technical analysis.
Press enter or click to view image in full size
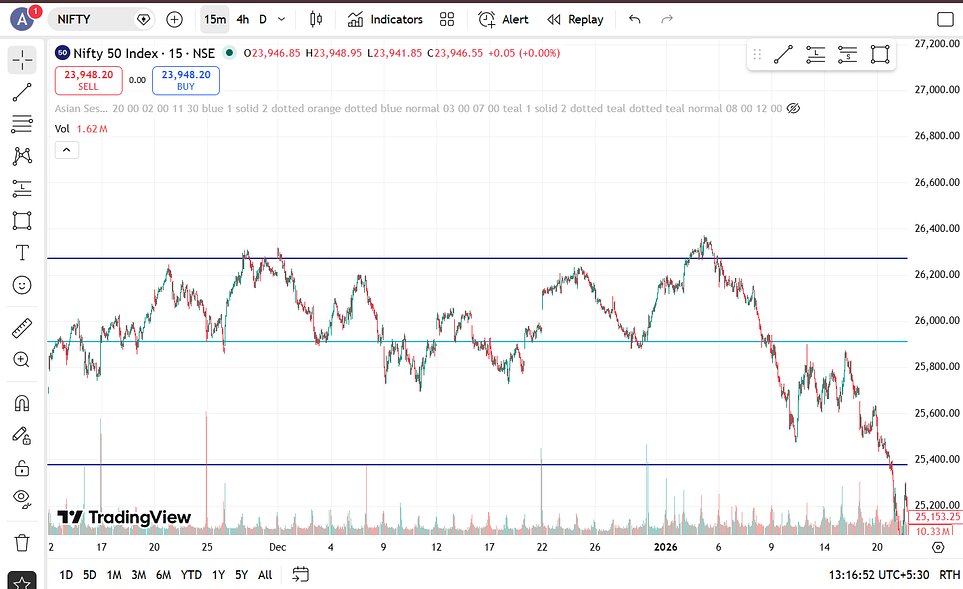
The easiest way to identify support or resistance level is to check whether the price touches the same level atleast twice and bounces back.
Logic —
1. The Bullish Setup (Buying / Longing)
You are looking to buy an asset at a proven historical value zone where buyers have a track record of defending the price.
Price Action: Identify a clear horizontal zone where the price has dropped down and aggressively bounced upward at least twice in the past (the floor). Wait for the price to slowly drift back down to this exact zone.
The Confirmation: Do not just set a blind buy order at the line. Wait for the price to enter the support zone and form a strong bullish reversal candlestick pattern (like a bullish engulfing or a morning star).
The Execution: Enter a long position on the close of the bullish confirmation candle, placing your protective stop-loss just beneath the safety of the support floor.
2. The Bearish Setup (Shorting / Selling)
You are looking to short an asset at a proven historical supply zone where sellers routinely dump their shares.
Price Action: Identify a horizontal zone where the price has rallied up and been rejected sharply down at least twice before (the ceiling). Wait for the price to rally back up into this zone.
The Confirmation: Watch for the buyers to lose momentum as they hit the ceiling, signaled by a bearish rejection candlestick (like a shooting star or a long upper wick) showing that sellers have re-entered the room.
The Execution: Enter a short position on the close of that bearish rejection candle, anticipating a drop back down toward the floor.
In trading, there are winners and there are losers. Support and resistance zones are incredibly powerful, but retail traders make a fatal mistake: they treat them as exact, thin lines on a chart. In reality, they are wide, messy zones filled with institutional traps. Algorithms know exactly where retail traders hide their stop-losses right below supportIn trading, there are winners and there are losers. Support and resistance zones are incredibly powerful, but retail traders make a fatal mistake: they treat them as exact, thin lines on a chart. In reality, they are wide, messy zones filled with institutional traps. Algorithms know exactly where retail traders hide their stop-losses right below support.
6. Session based Strategies
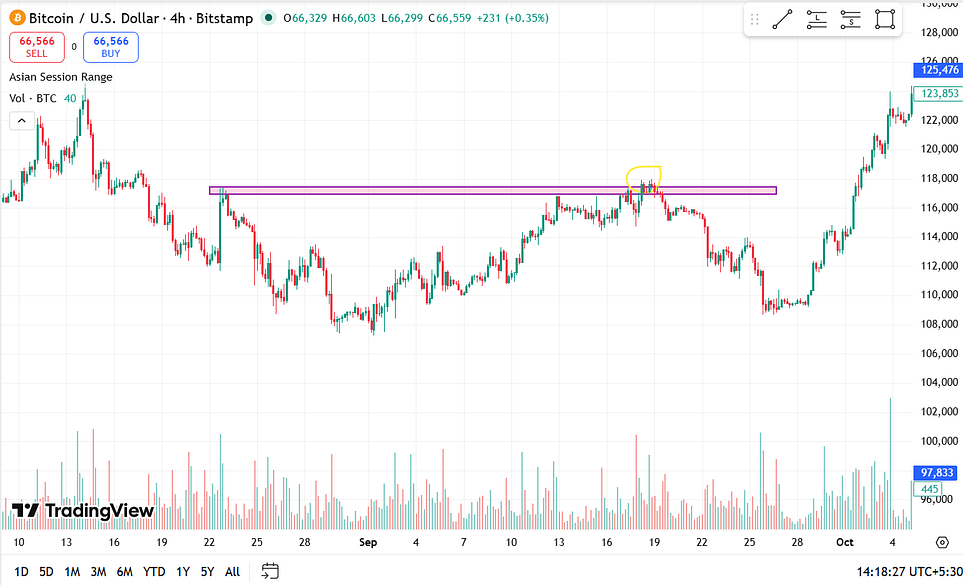
This strategy is mostly used in forex. I am still new to forex and seen people make profit out of this. I am backtesting my own setups around this and therefore this strategy is in middle for now.
Press enter or click to view image in full size
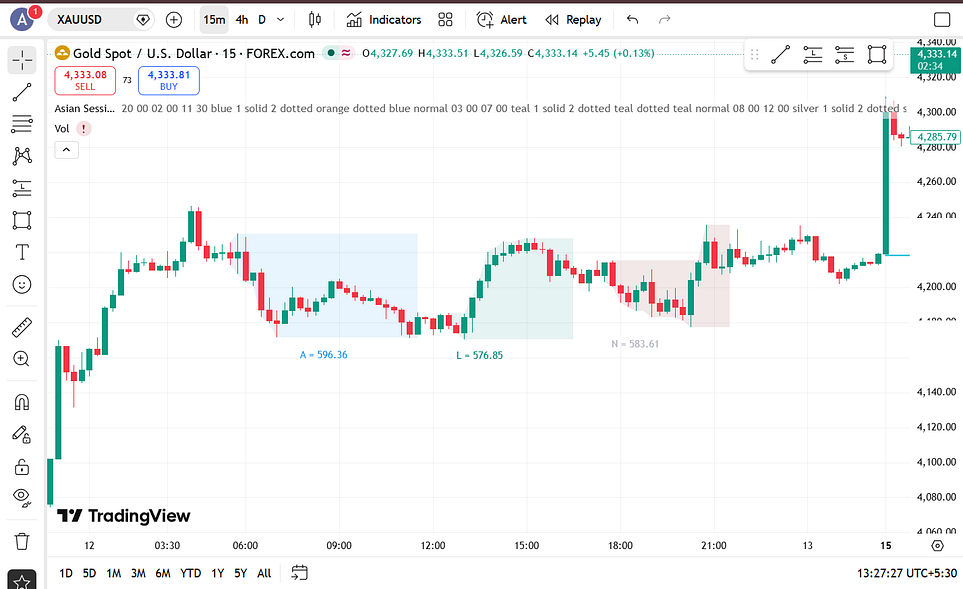
Think of the 24-hour market like a global relay race run by three massive runners: the Asian session (Tokyo/Sydney), the London session, and the New York session.
The Asian session is the patient, slow runner. It moves at a steady, quiet pace, packing the price into a neat, tight box. But when London and New York wake up, the heavy hitters step onto the track.
You can use the session indicator to mark sessions like I used
Logic —
1. The London Open Expansion Setup (Buying)
You are looking to buy a market that uses early morning manipulation to sweep retail stop-losses before launching upward.
Price Action: Draw a tight box enclosing the absolute high and low points created during the quiet Asian session (the Asian Range). Wait for the clock to strike the open of the London session.
The Hunt: Look for a sudden, aggressive bearish candlestick that drops straight down below the bottom of the Asian Range. This is a false move designed to trigger retail sell-stops and trap breakout sellers.
The Execution: The moment the price aggressively reverses, sweeps back up, and a strong bullish candle closes back inside the Asian Range, enter a long position. You are riding the institutional momentum as they leave the trapped sellers behind.
2. The New York Reversal Setup (Shorting / Selling)
You are looking to short a market that has run completely out of breath during the heavy overlap between London and New York.
Price Action: Track the aggressive trend established earlier during the London session. Wait for the New York session to open, bringing a massive secondary spike in volume.
The Overlap: Watch the price make a final, exhausted push upward into a key daily high or old liquidity level during the first two hours of New York trading (the session overlap).
The Execution: Enter a short position when you see a sharp institutional rejection pattern (like a failure to break the London high or a sudden bearish shift in market structure), capturing the late-day profit-taking drop.
In trading, there are winners and there are losers. Session-Based strategies force you to become a highly disciplined sniper who only trades during hyper-specific “kill zones” of high volatility. But the major pitfall here is Daylight Saving Time (DST) and macroeconomic news.
5. Breakout Trading
Market creates levels and patterns. These levels are tested multiple times by the buyers and sellers, creating invisible psychological lines on your chart known as support and resistance.
Think of breakout trading like a prisoner trying to break out of a cell by repeatedly throwing their weight against the door.Every single time the price hits a key level and bounces off, that door gets a little weaker. The traders who were holding that level start running out of orders. Eventually, the structural integrity of that level fails, the door bursts open, and the price explodes forward with massive momentum as trapped traders rush to exit their positions.
Every single time the price hits a key level and bounces off, that door gets a little weaker. The traders who were holding that level start running out of orders. Eventually, the structural integrity of that level fails, the door bursts open, and the price explodes forward with massive momentum as trapped traders rush to exit their positions.
Press enter or click to view image in full size
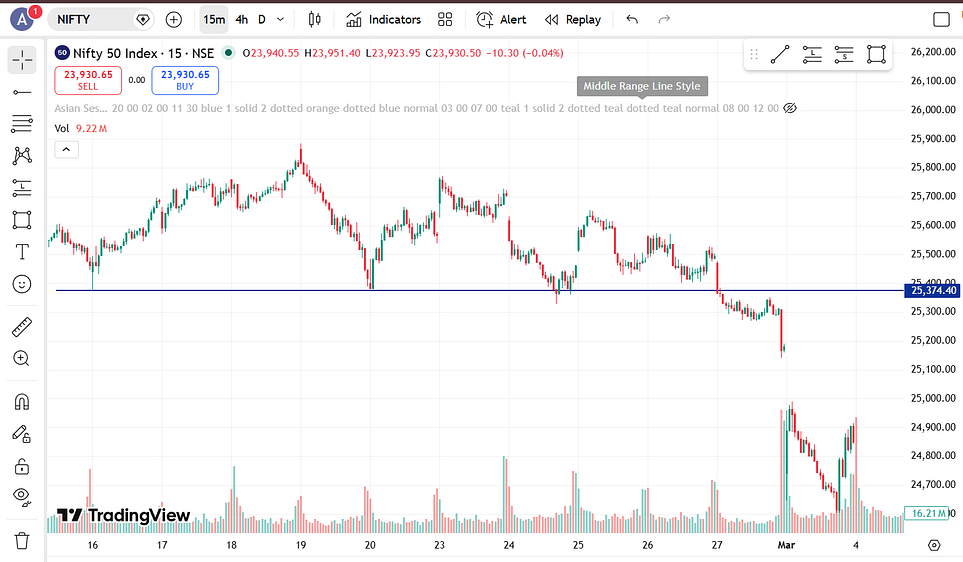
Very good example of breakout strategy
Press enter or click to view image in full size
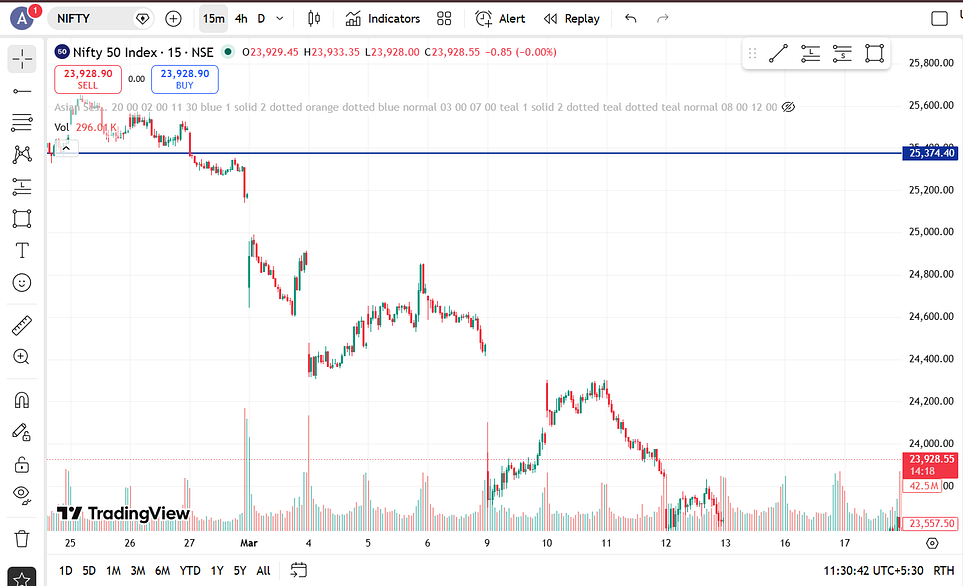
Logic —
1. The Bullish Setup (Buying / Longing):
You are looking for a market that has built up massive pressure under a ceiling and is ready to blast off.
Price Action: Identify a clear, clean horizontal resistance level (the ceiling) or a chart pattern (like a triangle) where the price has been rejected at least 3 times.
The Catalyst: Look for a strong, expansionary candlestick that aggressively pierces and closes above that resistance line, preferably on above-average volume.
The Execution: You enter a long position immediately after the breakout candle closes above the level. Alternatively, to avoid getting trapped, you wait for a “retest” — letting the price pull back to touch the old ceiling (which now acts as a floor) and buying when it bounces.
2. The Bearish Setup (Shorting / Selling)
You are looking for a floor that is about to give way, leading to a panicked sell-off.
Price Action: Identify a major horizontal support level (the floor) where buyers have repeatedly stepped in to save the market.
The Catalyst: A decisive bearish candlestick slashes straight down and closes completely below that support floor.
The Execution: You enter a short position on the close of that breakout candle, or wait for the price to pull back up to test the old floor (now a ceiling) before shorting the rejection.
In modern markets, institutions and algorithms know exactly where retail traders place their breakout orders. They will intentionally push the price just past the level to trigger everyone’s buy orders, absorb that liquidity, and then instantly reverse the market in the opposite direction.
Using it alone won’t make you profitable but adding confluence to it might.
4. Fibonacci Trading
Once you move past chasing raw breakouts, you learn to love the pullback. But how do you know exactly when a retracement is a healthy resting point versus a total trend reversal? This is where Fibonacci Trading comes into play, shifting your charts from simple geometry into the realm of natural mathematical ratios.
Think of a strong market move like an elite athlete sprinting up a steep hill. No matter how well-conditioned the runner is, they cannot sprint forever without collapsing. Eventually, they have to stop, take a breath, and let their heart rate recover before making the next push toward the summit.
The Fibonacci Retracement tool measures exactly how far that runner is dropping back to rest. The market moves in a natural rhythm, and the key mathematical ratios — specifically the 50%, 61.8%, and 78.6% levels — act as hidden premium discount zones where institutional buyers are waiting to catch the asset at a wholesale price before driving it higher.
Press enter or click to view image in full size
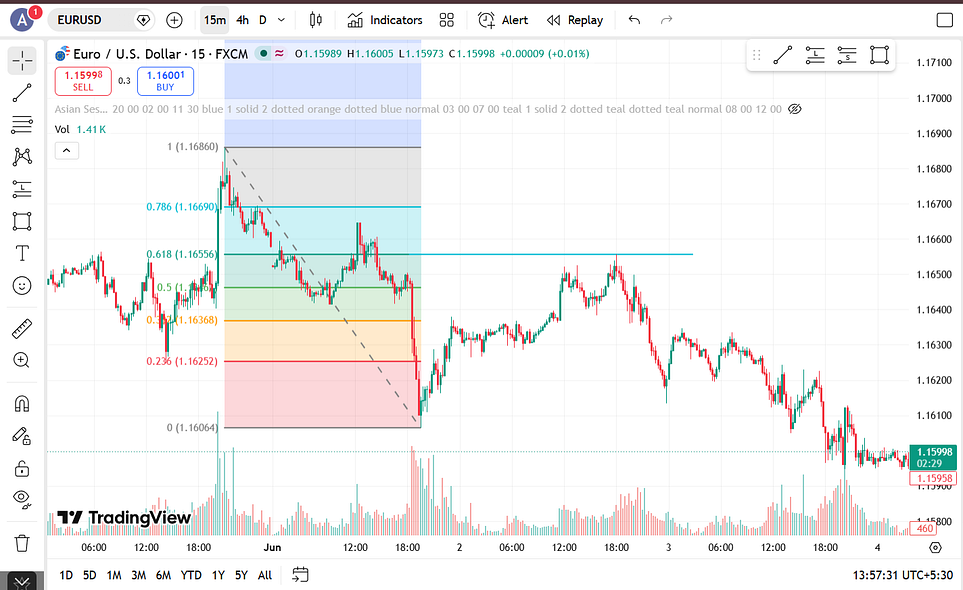
I marked the fibonacci from thw swing high to swing low, you see when price reached the 0.618 level it got pushed down.
Logic —
1. The Bullish Retracement Setup (Buying / Longing)
You are looking to buy a strong uptrend at a deep mathematical discount.
Price Action: Identify a clean, explosive impulse move upward. Anchor your Fibonacci tool at the absolute swing low (the start of the sprint) and drag it to the absolute swing high (where the runner stopped to rest).
The Golden Zone: Wait patiently for the price to bleed backward into the “Golden Zone” between the 0.5 (50%) and 0.618 (61.8%) retracement levels.
The Execution: You do not buy the exact moment the price touches the line. You enter a long position when a bullish confirmation candle closes within or just outside the Golden Zone, proving the market is treating the math as a solid floor.
2. The Bearish Retracement Setup (Shorting / Selling)
You are looking to short a heavy downtrend after a temporary, exhausted relief rally.
Price Action: Identify a sharp, aggressive impulse leg downward. Anchor your Fibonacci tool at the swing high and drag it down to the swing low.
The Premium Zone: Watch the market slowly bounce upward, retracing its losses. You are waiting for the price to climb up into the premium shorting territory at the 0.618 or 0.786 Fibonacci levels.
The Execution: Enter your short position when the price hits these upper ratios and forms a clear bearish rejection candle, signaling that the relief rally is out of fuel and the macro downtrend is resuming.
In trading, there are winners and there are losers. Fibonacci levels can feel like magic when a chart bounces perfectly off a 61.8% line down to the exact penny. But the brutal truth is that Fibonacci lines are a self-fulfilling prophecy. They work because millions of retail traders are all staring at the exact same lines and placing their orders there simultaneously. If a major financial fund decides to dump billions of dollars of shares, they couldn’t care less about a natural mathematical ratio; they will smash straight through your Golden Zone without a second thought. Relying blindly on the tool without understanding who is holding the order book is a shortcut to getting wiped out.
3. Liquidity sweep strategy
When you reach this level of trading, you stop looking at charts as simple lines, shapes, or mathematical ratios. Instead, you start looking at charts through a single, brutal lens: Liquidity.
Think of a massive institutional bank or hedge fund like a giant, heavy battleship trying to turn around in a tiny, shallow harbor. Because they are trading billions of dollars, they cannot simply click a button and buy 50,000 shares without causing the price to instantly skyrocket against them. To fill their massive buy orders at a good price, they need an equal and opposite wave of people who are desperate to sell.
Where do they find a massive pool of desperate sellers? Right underneath obvious double bottoms, daily lows, or support levels where thousands of retail traders have placed their stop-losses. This strategy is all about tracking the battleship as it intentionally drives the price past a key level to trigger everyone’s stops, vacuums up those orders, and aggressively sails away in the opposite direction.
Press enter or click to view image in full size
Logic —
1. The Bullish Liquidity Sweep (Buying / Longing)
You are looking to buy the exact moment the market engine triggers a mass retail panic to fuel an institutional rally.
Price Action: Identify a clean, obvious historical low point or a “double bottom” equal-low level on your chart. This is the “Liquidity Pool” where retail buy-stops or protective sell-stops are heavily stacked.
The Sweep: Wait for a high-momentum candlestick to aggressively pierce below that low level. This trick fools breakout sellers into shorting, while simultaneously knocking retail buyers out of their positions.
The Execution: You enter a long position the exact moment that aggressive candlestick reverses and closes back above the key low level, leaving behind a massive lower wick. This proves the liquidity was swept, the traps were sprung, and the market is cleared to move upward.
2. The Bearish Liquidity Sweep (Shorting / Selling)
You are looking to short the exact moment the market triggers a buying frenzy to cover institutional short positions.
Price Action: Identify an obvious prominent high point or a “double top” level on your chart where buy-stops (the exit orders for short sellers) are sitting in mass quantities.
The Sweep: Watch for a sharp, sudden rally that pierces above that high level, tricking eager breakout traders into buying the “breakout.”
The Execution: Enter a short position when the price fails to hold that high and violently closes back below the swept level. You are riding the wave as the institutional sellers yank the rug out from under the trapped buyers.
The Liquidity Sweep strategy completely changes how you view a chart because you stop being the prey and start thinking like the hunter. But the major catch here is execution precision and timing. If you jump the gun and buy the moment the price crosses below a support level before the candle actually closes, you might just be catching a falling knife during a legitimate market crash.
2. Smart Money Concepts
In SMC, traders do not care about retail lines; they are strictly tracking the “footprints” (the structural breaks and unfilled orders) left behind by institutional algorithms when they move the market.
SMC has its own language. We should focus on the three most critical concepts that create the setups:
CHoCH (Change of Character): This is the very first sign that the giant is changing direction. It’s when the market stops making higher highs and aggressively breaks the previous structural low.
BOS (Break of Structure): This confirms the new direction. It’s when the price continues the momentum and breaks through the next major swing high or low.
Order Blocks (OB): The footprints themselves. These are the specific candlesticks where institutions placed massive buy or sell blocks, leaving behind a massive imbalance that the market must eventually return to fill.
The Logic / Setup Structure —
The Bullish Setup (Buying / Longing)
Market Structure: The price is in a downtrend but suddenly prints a CHoCH by aggressively blasting above the recent lower high.
The Footprint: This explosive move leaves behind a Bullish Order Block (the last bearish candle before the massive upward expansion) and an imbalance/fair value gap.
The Execution: The trader places a limit order to buy exactly when the price drifts back down to mitigate (re-test) that specific Bullish Order Block, placing a incredibly tight stop-loss just below it.
The Bearish Setup (Shorting / Selling)
Market Structure: The price is in an uptrend but aggressively snaps below the recent higher low (CHoCH), signaling that the buyers have lost control.
The Footprint: This downside expansion highlights a clear Bearish Order Block (the last bullish candle before the crash).
The Execution: The trader enters a short position when the price rallies back up to tap into that Bearish Order Block, riding the institutional wave downward as the algorithm fills its remaining sell orders.
Times change and so does market
The Trap: In trading, there are winners and there are losers. SMC makes retail traders feel elite because they use fancy acronyms like CHoCH, BOS, and OB. But the brutal truth is that SMC is just old-school price action with a marketing facelift.
The Failure: Because it has become so incredibly popular, retail SMC traders have essentially become the “new liquidity.” Algorithms now intentionally print fake CHoCHs and fake Order Blocks to trap SMC retail traders, hunting their tight stop-losses before moving the market.
1. ICT concepts
We have finally reached the top of the mountain. If Smart Money Concepts taught you to look for the footprints of the giant, Inner Circle Trader (ICT) concepts teach you to decode the actual digital programming of the algorithm that controls the giant. This is the most complex, precise, and mentally demanding strategy on this list.
Think of the modern financial market like a highly advanced, automated vending machine. The machine doesn’t care about your feelings, your trendlines, or your chart patterns. It runs on a rigid, predatory computer code designed to do two things over and over again with mathematical precision: hunt liquidity (stop-losses) and rebalance structural inefficiencies.
Instead of guessing where the price might go, an ICT trader acts like a code-breaker. You are waiting for the algorithm to execute a hyper-specific sequence of events during a precise minutes-long window of the day. When that sequence triggers, you step in right alongside the algorithm.
Logic —
1. The Bullish Setup (The Silver Bullet / Model 2026 Buy)
You are looking for the algorithm to engineer a liquidity trap and instantly rebalance the market during a specific daily time window (the “Killzone”).
Price Action & Timing: Sit on your hands until a specific algorithmic time window opens (like the New York Silver Bullet window from 10:00 AM to 11:00 AM EST).
The Raid: Watch the market aggressively reach down to sweep a prominent pool of liquidity — like a previous session low or an old daily low.
The Displacement: Immediately after the sweep, look for a sudden, violent launch upward. This explosive move must break the local market structure to the upside, leaving behind a clean Fair Value Gap (FVG) — a distinct three-candle pattern where the market moved so fast it left an un-traded price imbalance.
The Execution: Place a buy order at the exact top framework of that Fair Value Gap. As the algorithm briefly dips back down to fill that imbalance, your order is triggered, allowing you to ride the massive algorithmic expansion upward.
2. The Bearish Setup (The Silver Bullet / Model 2026 Sell)
You are looking to short the market as the algorithm engineers a trap at old highs and rapidly reprices downward.
Price Action & Timing: Open your charts during the designated Killzone window. Identify the key pools of buy-side liquidity (old session highs or equal highs).
The Raid: The algorithm spikes the price upward, piercing through those highs to activate retail buy-stops and trap breakout traders.
The Displacement: The market instantly reverses with massive downward displacement, crashing through the local structural support floor and leaving a glaring, bearish Fair Value Gap (FVG) in its wake.
The Execution: Enter a short position the exact moment the price retraces slightly upward to tap into the bearish Fair Value Gap. Your stop-loss is safely locked just above the displacement high, and you target the opposing sell-side liquidity pool below.
In trading, there are winners and there are losers. ICT concepts are ranked number one for a reason: when mastered, they offer unmatched precision, sometimes allowing traders to catch moves down to the exact tick with incredibly tight risk-to-reward ratios. But here is the brutal reality that ruins 99% of beginners who attempt it: it is an absolute mental meat-grinder.
Bonus
CPR trading strategy
I have written a dedicated blog post for this strategy
This is what I use to be profitable.
These are strategies you know of and have no experience in.
My advice —
Learn → Understand → Backtest → Implement
Dont just take my word, build your own setups around these strategies.
Follow me on Twitter/X:- https://x.com/abh_hai_
for active updates on trading and strategies.
📩 Join Investor’s Handbook Digest — get the best investing, markets, and wealth-building insights each week.
I am Quant Trader with experience of 12 months. I am learning and growing as I document my journey and findings. I do Market data research, backtest and derive insights from data.