What happens when AI stops funding itself?


One cash-flow chart sent me back to the fiber boom, merchant power and a question I now find more useful than “is AI a bubble?”
The bar that caught my attention in this chart was not the red one in 2027. It was the almost invisible green bar immediately before it.
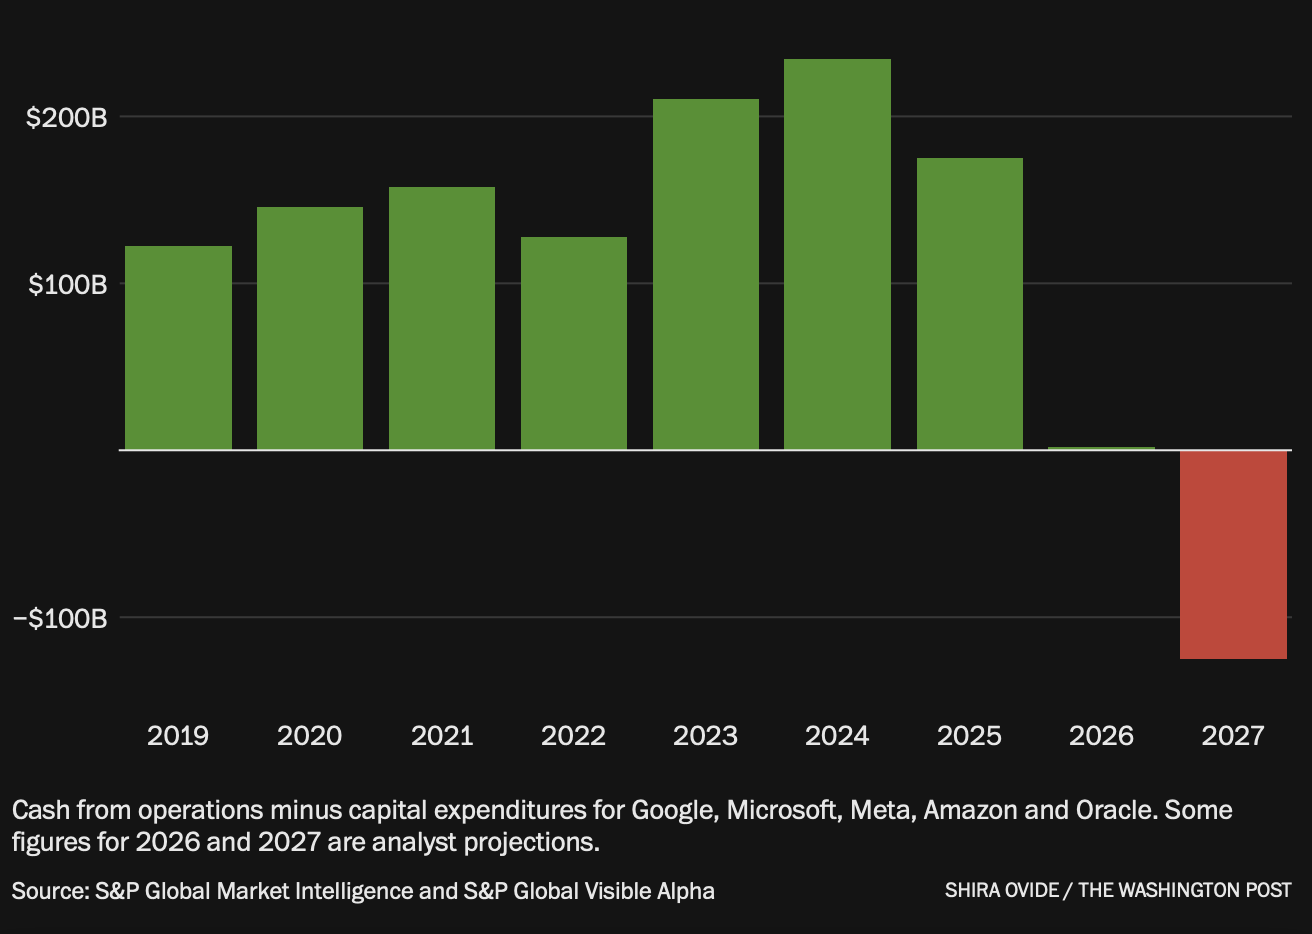
The chart, based on S&P Global Market Intelligence and Visible Alpha data, takes cash generated from operations by Google, Microsoft, Meta, Amazon and Oracle and subtracts their capital expenditure. Roughly $230 billion was left in 2024, around $175 billion in 2025, and the projection approaches zero in 2026 before turning sharply negative in 2027.
There are obvious qualifications. This is total capex, not a clean measure of AI spending, and the last two years are estimates. But the direction is worth looking at. Reuters, using LSEG forecasts, calculates that capex for Microsoft, Alphabet, Amazon, Meta and Oracle could rise by about $534 billion through 2027, against roughly $340 billion of additional operating cash flow. That is about $1.57 of incremental investment for every additional dollar of operating cash generated. (Reuters)
I initially read this as another sign of extravagant AI spending. After spending some time with the historical numbers, I think there is a more useful interpretation.
For years, these businesses generated enough cash to finance infrastructure and still leave a substantial surplus. As that surplus approaches zero, capital markets, leases, and long-term financing become more important to the expansion. The technology may still be working perfectly well. What changes is who has to finance the next unit of capacity, and under what terms.
That is where the historical comparison becomes useful.
Fibre was not a story about imaginary demand.
The late-1990s telecom boom is usually reduced to “companies laid too much fibre.” That skips the mechanism.
Demand was real. US internet backbone traffic grew from 16.3 terabits per month in 1994 to around 1,500 terabits per month by 1996. New carriers such as Qwest, Level 3 and Global Crossing were responding to an internet that was genuinely expanding at extraordinary speed. (FRASER)
There was also a competitive problem. If one carrier believed internet traffic would dominate communications, sitting out the build was dangerous. AT&T, MCI, WorldCom and Sprint controlled 72% of US long-haul fibre in 1996. By 1999 their share had fallen to 30% as entrants built competing networks. (Federal Reserve Bank of Richmond)
The less obvious problem sat inside the fibre itself.
In 1996, one strand could transmit about 2.5 Gbps. Four years later, the same strand could carry about 100 Gbps, largely because wavelength-division multiplexing allowed many channels to run over the same physical fibre. (FRASER)
So two things happened at once. Companies laid more fibre, while engineers multiplied the effective capacity of fibre already in the ground.
Demand continued to rise. The internet was hardly a failed prediction. But bandwidth scarcity weakened much faster than the financial models used to build the networks had assumed.
This is the part I find relevant to AI. Counting GPUs or data-centre megawatts is not enough. What matters economically is how much useful work each dollar of infrastructure can produce. Better chips matter, but so do quantisation, caching, distillation, smaller models, better scheduling and software that keeps expensive hardware busy for more hours.
AI usage can therefore grow very quickly while the scarcity value of compute falls. Fibre showed that those two things can coexist.
Global Crossing makes the financing shift visible.
Global Crossing’s 1999 filing is unusually instructive because the change happens almost in front of you.
In 1998, the company generated about $209 million in operations and spent $414 million on network construction. It raised $392 million through common equity, $796 million through senior notes, and about $291 million through long-term borrowing.
One year later, cash spent on construction had risen to $1.58 billion. Acquisitions added another $2.46 billion of investment. Common-equity proceeds had fallen to $111 million, while senior-note issuance reached $2 billion and gross long-term borrowing $3.54 billion. Long-term debt on the balance sheet moved from $1.07 billion to just over $5 billion.
This was not a neat switch when equity stopped on Friday, and debt began on Monday. Equity valuations were part of what made the borrowing possible.
Alan Greenspan described the mechanism in 2002. Telecommunications companies worldwide borrowed more than $1 trillion between 1998 and 2001. At the time, this looked relatively prudent because their equity values were so high that lenders assumed shares could always be issued later to repay debt if necessary. When telecom stocks collapsed, that option disappeared. (Federal Reserve)
Global Crossing’s own filing gives a sense of the confidence at the time. A $100 investment in its shares at the August 1998 listing was worth $392 by the end of 1999. The company was building what it described as a 101,000-route-mile global network.
The technology did not stop working. The capital structure got impacted.
Exodus Communications gives an even more tangible example. It built internet data centres and reached a market value over $30 billion. After the collapse, Freddie Mac bought an Exodus data centre in Herndon, Virginia for $5.5 million. It had cost about $50 million to construct. Industry analysts at the time were seeing data-centre assets trade at discounts of 50% to 90% to construction cost. (The Washington Post)
The asset had not become useless. It had become useful at the wrong capital price.
That sentence is worth keeping in mind when looking at AI data centres today.
The same mechanism appeared in power.
I wanted another case because fibre alone makes it too easy to conclude that this was something peculiar to the dot-com era.
Calpine provides one.
Around 2000, the company was building gas-fired power stations into a market where electricity shortages and high prices suggested more generation was needed. Its operating cash flow rose from about $314 million in 1999 to $803 million in 2000. Investment was moving much faster: roughly $1.6 billion in 1999, $3.75 billion in 2000, and $7.5 billion in 2001. External financing rose alongside it, reaching nearly $7.9 billion in 2001.
Equity still mattered in 2000. Calpine sold 23 million shares at $34.75 that August. By the following year, the funding mix was dominated by senior notes, convertibles and project debt.
Then a lot of new generation arrived.
By Calpine’s own later account, its expansion more than doubled installed generating capacity between 2001 and 2004 and was funded primarily through corporate debt and project finance. Funded debt exceeded $17 billion by the end of 2004. A weak power market, fuel costs, and debt service eventually produced the liquidity crisis that took Calpine into Chapter 11 in December 2005. Its power stations continued operating.
The recurring pattern is fairly simple once the drama is removed. A shortage offers attractive returns. Competitors respond to the same price signal. Investments allow capacity to arrive faster than operating cash alone would permit. If scarcity then eases, the asset still works, but the return assumed when the debt was issued may no longer be available.
That is closer to what I am looking for in AI.
Where AI is different today
The strongest objection to this comparison is also the reason I would not call the current buildout a bubble.
Demand is still exceptionally strong.
Microsoft’s latest quarter had Azure growing 43%. It spent about $41 billion on capex and still produced $19.6 billion of free cash flow. Amazon reported AWS growth of 37% and trailing operating cash flow of $161.4 billion, although free cash flow had declined to negative $7.6 billion as property and equipment investment rose sharply. Meta has $31.9 billion in operating cash in Q2 and $784 million in free cash flow after $31.1 billion in capex and finance lease principal. (Reuters).
These are not Global Crossing’s economics.
But there is now meaningful dispersion inside the group. Alphabet reported negative free cash flow in Q2 after $44.9 billion of capex. Oracle generated a record $32 billion in operating cash in fiscal 2026 but spent $55.7 billion on capex, and a negative $23.7 billion in free cash flow. CoreWeave says directly in its filing that its infrastructure is financed through a mix of debt, equity, term loans, OEM finance and balance-sheet cash. (Reuters)
Then some commitments do not yet sit fully on the balance sheet. Microsoft, Meta, Oracle, Amazon and Alphabet have disclosed about $1.09 trillion of payments under leases that have not yet commenced, much of it associated with future data-centre capacity. Microsoft alone has $329.1 billion in that pipeline; Oracle about $260 billion. (Reuters)
Those figures need careful handling. They are not $1.09 trillion of current debt and should not be treated as such. Payments stretch on many years, and some facilities are conditional or have not entered service.
What they do show is less dramatic but useful: today’s infrastructure decisions are developing longer tails. Once a site, power agreement, lease and financing package have been signed, changing your mind becomes more expensive.
That is where risk starts to migrate.
I ended up with three outcomes, not one forecast.
The first possibility is straightforward. AI becomes cheaper, and demand expands even faster. Agents, coding, video, scientific workloads and enterprise automation absorb the capacity being built. Utilisation remains high, and cash generation eventually catches up. Call it demand absorption.
A second outcome is less intuitive. AI succeeds, perhaps far beyond today’s expectations, but useful compute becomes abundant. Consumption rises while the price of producing a unit of intelligence falls faster. Infrastructure margins and returns then compress even though AI adoption looks excellent. That is capacity repricing, and it is the part of the fibre experience I would take most seriously.
The third is a financing break. It does not require weak AI demand. A leveraged provider reaches the point where the cost of financing the next data centre, GPU fleet or power contract no longer generates the expected return. The physical assets remain useful. They may need a different owner and a lower capital basis.
I do not think the public data support assigning confident probabilities to these outcomes. The number I would most like to know is still largely unavailable: the economic utilisation and realized return on each new block of GPU capacity.
That limitation changed what I wanted from the analysis.
Instead of trying to identify the single correct scenario, I would rather be positioned so that being wrong is survivable. In decision theory, that is close to maximin or minimax regret. In ordinary investment language, it means paying attention to balance-sheet strength, reversibility and businesses that benefit when intelligence becomes cheaper, rather than assuming today’s bottleneck will remain scarce indefinitely.
So the chart eventually turned into a monitoring task.
I now watch the price of useful intelligence relative to consumption; realized compute pricing and utilisation where data are available; operating cash flow against capex and fixed commitments; the cost of marginal financing through bonds, credit spreads and project finance; and one behavioural signal that may matter more than the rest.
Can a major hyperscaler reduce incremental AI infrastructure spending without losing AI growth?
If one company manages it, I want to understand why. If two manage it, I would reopen the model. That is the point at which the spending race may no longer be enforcing itself.
The task I set up therefore does not aim to predict the date of an AI crash. It is looking for evidence that the financing regime, capacity economics, or competitive game has changed.
That is a much more useful alert than another headline telling me whether AI is a bubble.
________________________________________________________________
Disclaimer: Views or opinions represented in this article are personal and belong solely to the article writer and do not represent those of people, institutions or organizations that the writer may or may not be associated with in professional or personal capacity, unless explicitly stated.
_________________________________________________________________
Frequently Asked Questions
What does the chart showing AI company cash flow reveal about future AI spending?
The chart shows that operating cash flow minus capital expenditure for Google, Microsoft, Meta, Amazon, and Oracle is projected to approach zero in 2026 and turn negative in 2027, meaning these companies will need external financing rather than self-funding their AI infrastructure expansion.
How much additional capital investment is needed compared to operating cash flow through 2027?
According to Reuters forecasts, these tech companies need about $1.57 of incremental investment for every additional dollar of operating cash generated, totaling roughly $534 billion in capex against $340 billion in additional operating cash flow through 2027.
Why is the fiber boom of the 1990s relevant to understanding current AI spending?
The fiber boom demonstrates how real demand can coexist with unsustainable financing mechanisms—carriers had genuine internet traffic growth but faced competitive pressure to build redundant networks, similar to current AI infrastructure dynamics.
What technological breakthrough allowed fiber networks to increase capacity without laying new cable?
Wavelength-division multiplexing technology allowed the same fiber strand to carry roughly 40 times more data (from 2.5 Gbps to 100 Gbps in four years) by running multiple channels over one physical fiber.
What changes when AI companies can no longer self-finance their infrastructure?
As operating surplus approaches zero, capital markets, leases, and long-term financing become more important for expansion, shifting who finances the next unit of capacity and under what terms, rather than indicating the technology itself is failing.
Did the demand for internet bandwidth in the 1990s turn out to be real or imaginary?
Demand was real—US internet backbone traffic grew from 16.3 terabits per month in 1994 to around 1,500 terabits by 1996, but the competitive build-out created overcapacity financing problems despite genuine underlying demand growth.
Flavio Aliberti brings with him a 25-year track record in consulting around business intelligence, change management, strategy, M&A transformation, IT and SOX auditing for high regulated domains, like Insurance, Airlines, Trade Associations, Automotive, and Pharma. He holds an MSc in Space Aeronautic Engineering from the University of Naples and an MSc in Advanced Information Technology and Business Management from the University of Wales.