
It can be a useful exercise to attempt to prove empirically what we believe we already know. The resulting exercise can produce one of 2 results: in one case we surprise ourselves with results contradicting our initial hypothesis, leading to a new discovery. Or in most cases, we prove our hypothesis, and in doing so become more knowledgeable and most importantly, empirical about the topic.
Today will be no exception. In this piece, I want to follow the same empirical approach, investigating in detail the relationship between President Donald Trump’s media activity and the volatility of stock prices.
The analysis will focus on three core questions:
- Does an increase in Trump‘s media presence lead to an increase in stock price volatility?
- If so, can we see a leading or lagging indicator to this phenomenon in markets?
- If so, what is the expected time frame for these impacts to manifest in stock prices?
To answer these questions, I developed a custom script to query Premind’s proprietary data set. This data set offers a uniquely granular view, connecting in finite detail the production of news to asset price movements. Using this data, I identified instances in which Donald Trump was mentioned in relation to individual S&P500 constituents, and then reviewed the subsequent price moves of the stocks.
The price moves were analysed in increments of 1% up to a maximum of 5%. For each basket, I counted how many stocks moved by that amount, while also being associated with Trump media announcements.
So does an increase in Trump related media activity lead to greater stock price volatility? The data suggests a clear yes, and here’s the results to prove it:
During the first 200 days of his presidency, the number of S&P 500 companies linked to Trump-related media mentions in any rolling 24-hour period ranged from as few as 10 to as many as 97. This variation corresponds strongly with the intensity of price movements.
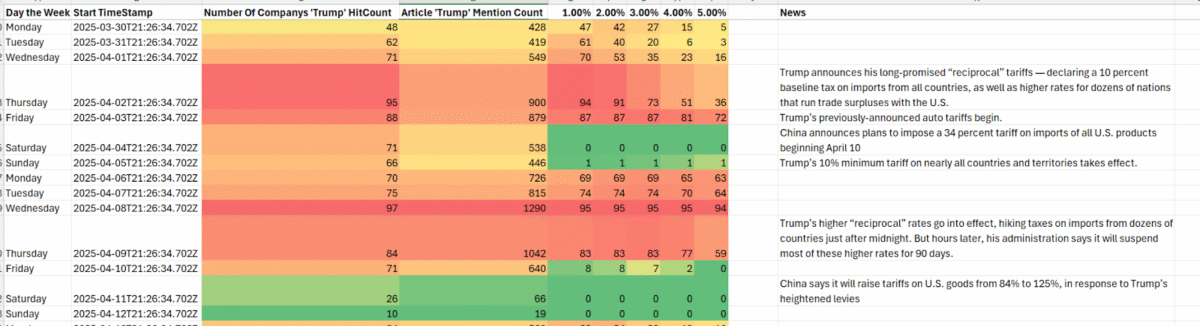
The following data snippet, illustrates this correlation, using colour-coding to reflect both the number of companies mentioned and the magnitude of their price changes where red showing higher media and numbers of stocks moving. The 1–5% columns indicate how many stocks moved by that percentage within the observed 24-hour window, peaking during periods of heightened media activity.
In the below, we see the height of the tariff impacts.
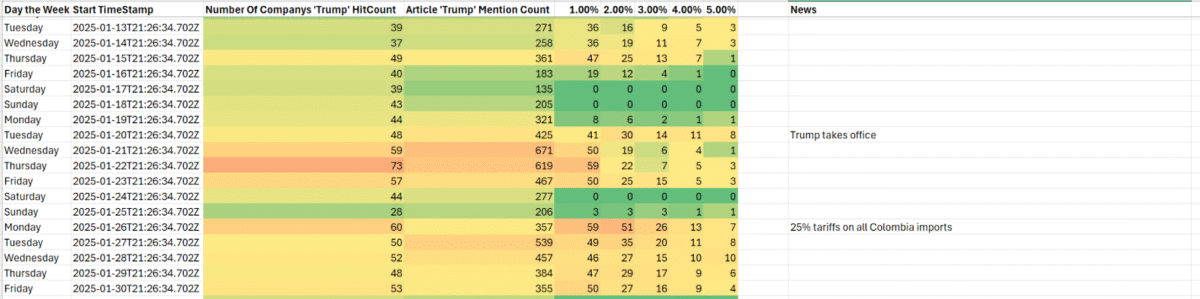
We can see in quieter periods below, say before his inauguration:
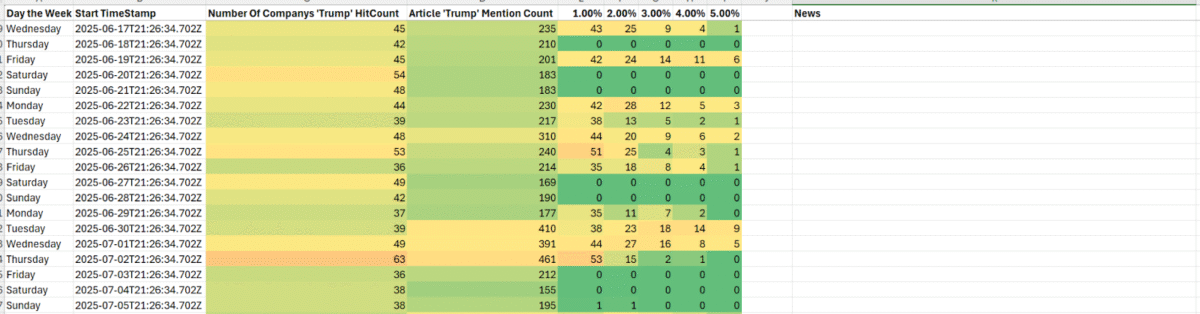
And more recently:
Enter the ‘MAGA-Phone’ effect:
A distinct “megaphone” effect emerges in these times of heightened Trump media impact. As more stocks get caught up in the news related to Trump, we not only see a greater number of stocks moving, but also larger magnitudes of movement. In some cases over 90% of the affected stocks experience price changes greater than 5%. This suggests Trump‘s media presence is not merely coincidental, but the primary driver of market volatility in the first image above.
Is Trump’s activity in the media a lead indicator? Possibly. Internally, Premind looks at the timing of news releases to asset price reactions in minute level intervals, in this analysis, by rolling over a 24 hour period, that minute level of granularity is lost. Deep dive analysis conducted internally often demonstrates a lead indicator in the news release. In certain cases, we have also observed market activity preceding the official announcements, implying that information may have leaked or otherwise obtained early by market participants
Although this study focuses on broader narrative level observations rather than tick-level reaction times, the findings suggest that surges in Trump’s media presence often foreshadow increased volatility. This may reflect a behavioural dynamic: when markets or geopolitical actors fail to respond, Trump escalates his rhetoric or actions, increasing pressure until a reaction is provoked. In this way, his media activity appears to play an active role in shaping market behaviour.
What’s the expected time for impacts?
Below we see the more high level ‘narrative’ pattern. That is, any update in news generally has an impact period of a few days. Above that level, it falls into a continuum of news events in a narrative which will generally span several weeks. This narrative pattern follows an arc depending on the relative importance of the narrative compared to other narratives in the news ecosystem at that time.
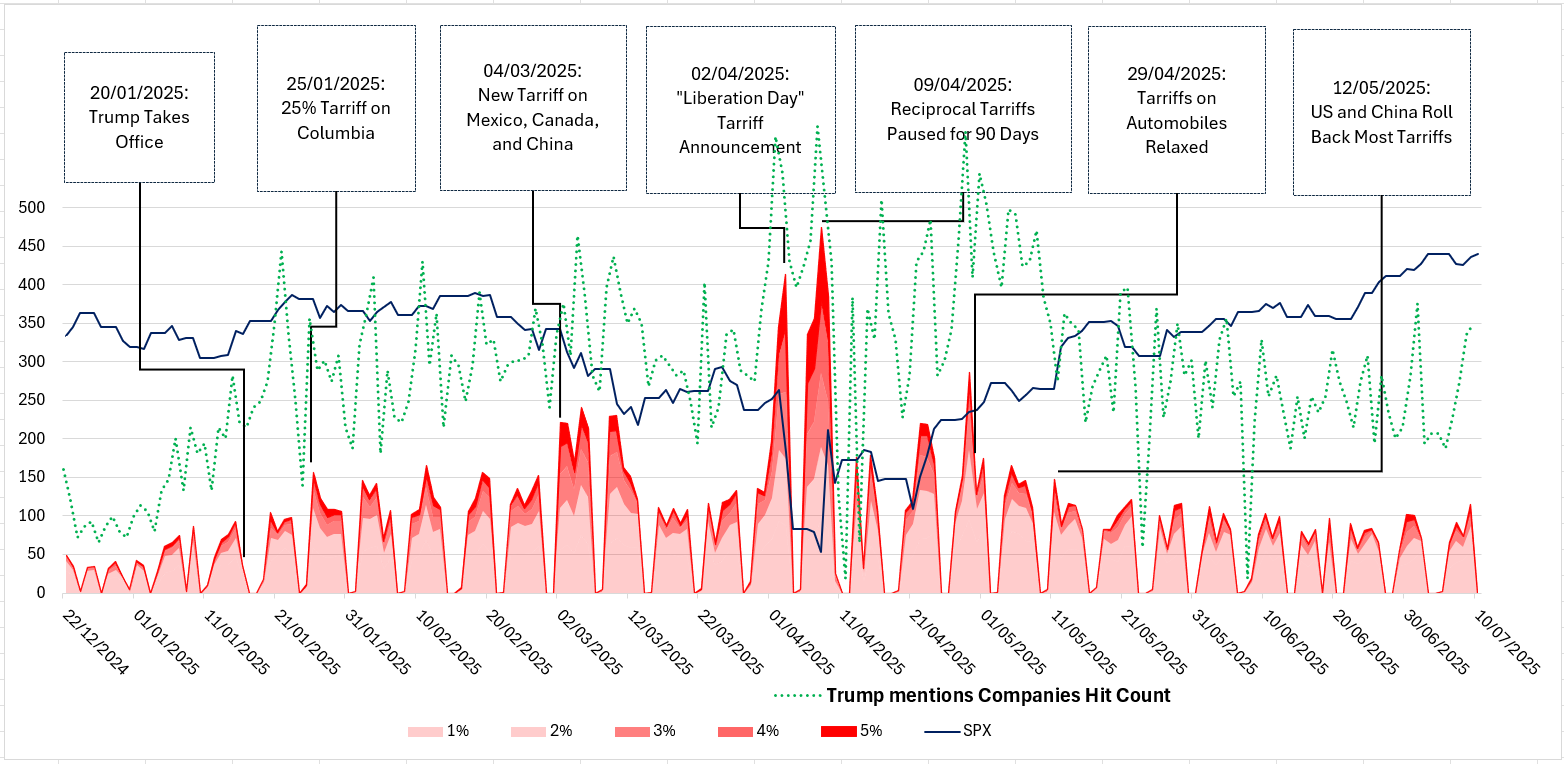
Below, we can see the entire period for Trump’s presidency until mid June. The red areas show the number of S&P500 stocks that moved from 1-5% over time. The blue line shows the SPX price over time. And the green dotted line shows the number of companies where Trump is mentioned in relation to the company in question.

What’s next?
Since June, we see a significant calming in the impact and quantum of stocks moving due to Trump’s media activity. Whether this reflects the market pricing in the famous ‘TACO effect,’ or a shift in Trump’s own media strategy, remains uncertain. The data does suggest, however, a waning sensitivity in market responses to his media presence—perhaps indicative of a ‘boy who cried wolf’ dynamic, where repeated shocks begin to lose their potency.
Special thank you to Henry Stewart for the assistance in data gathering and visualisations.