

Using Python to create a dashboard that can help you make more informed investment decisions about a company
In this article, I’ll show you how you can quickly create a single dashboard page that puts together several charts with financial information about the company you select.
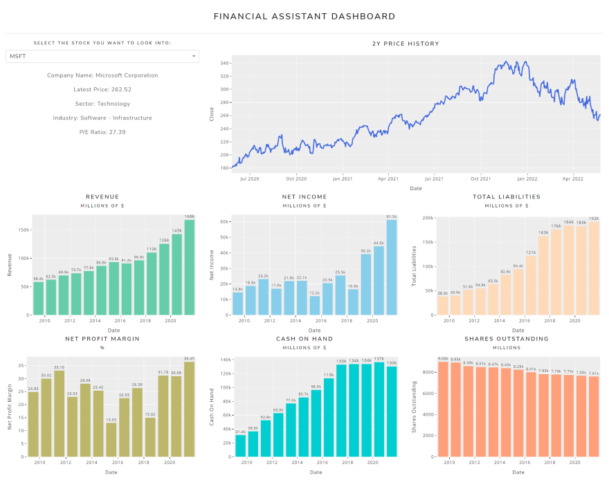
A single page to help you decide: “Buy, Sell or Hold?”
Instead of navigating through my broker’s app and having to scroll up and down, click multiple buttons, and repeat the process, this page will help me quickly understand how the financials of the company have evolved over time. It will certainly not tell me the future of the company. And it will not mention any scandals in the news that might also affect its price!
But it will help me answer a few fundamental questions:
- Is this company generating cash on a regular basis?
- Is it profitable?
- How much debt is being used to finance the business?
- Is the company buying back its stock?
- … much more!
Keeping it simple
We are going to use Python, Plotly, and a single Dash page. The code is very straightforward and you can grab the whole notebook here.
To get the financial information about the companies, I used my own custom scripts to collect the data from a few different sources. I collected data for a few companies, and the csv files needed are in the repository.
There are a few places you can get this information for your own stocks, but I recommend you use a library called yfinance. I show how to use it in a different article, and I also left some examples in the notebook for this project — look for the last cells there. It does not return as many time periods, but it is pretty easy to use nevertheless.
What metrics should we use?
Our dashboard page will include a few metrics that I usually look at when investing in any stock.
You may prefer other metrics, and if that is the case, you just have to adjust the charts to use the columns you want. The goal is to have all the stuff you want to see, combined on one single screen!
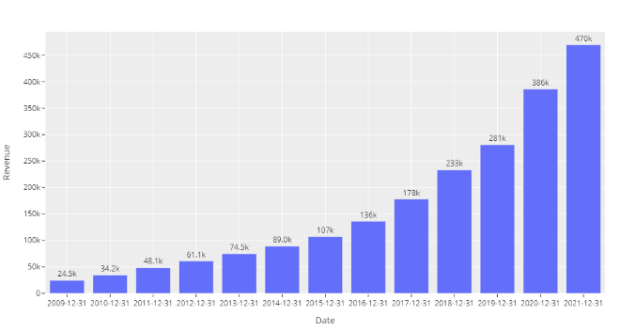
Revenue
Is this company capable of consistently generating money through its business activities?
Revenue is sometimes also called “Gross Sales” since the revenue comes from product sales for most companies. This one should be really simple to understand.
We want to invest in companies that are capable of growing, so if you see a company struggling to make money, look closer and try to understand what is happening with their business.
Net Income
Net Income is also known as “bottom line” since it appears as the last line on the income statement
Net Income can be calculated by subtracting business expenses, operating costs, and taxes from the sales revenue. It is also used when analysts calculate the earnings per share. This is not a perfect metric though, and it can be manipulated through aggressive revenue recognition or hidden expenses.
Some people prefer using the EBITDA (earnings before interests, taxes, depreciation, and amortization) metric. There really is no correct answer on what is best, but please review the quality of the numbers used to calculate them before you jump to conclusions!
Total Liabilities
Total liabilities are the combined debts and obligations that a company owes to outside parties
In isolation, total liabilities serve little purpose, other than perhaps comparing how different competitors are using debt to finance their operations. Bear in mind that a company can have short-term debt, and long-term debt. When in doubt, this is something I usually double-check in the financial report if I need more clarity.
This metric is also crucial to calculate ratios like “debt-to-equity” and “debt-to-assets”.
Net Profit Margin
Net Profit Margin measures how much profit is generated as a percentage of revenue
Net profit margin is one of the most important indicators of a company’s overall financial health, and it should be very clear why. Simply put, if a company has very small margins, it means that it spends almost as much to sell its products as it receives from sales.
While some businesses exist and thrive with low margins (but very high sales volume), ideally, you want to invest in a company that can generate a decent amount of profit.
Cash On Hand
The cash position is a sign of financial strength and liquidity
In addition to cash itself, this often takes into consideration other assets that can be converted into cash immediately. These include certificates of deposit, short-term government debt, and other cash equivalents (maturity is less than 3 months).
Companies exist to make money. When they do make money, they can pay their shareholders in the form of dividends, but they can also acquire other businesses and invest in product innovation.
This means they can also buy their own stocks (through a stock buyback), which will indirectly increase the share price — there will be fewer shares available.
Shares Outstanding
Shares outstanding refer to a company’s stock currently held by all its shareholders
As I mentioned above, to increase the market value of remaining shares and elevate overall earnings per share, a company may reduce the number of shares outstanding by buying back those shares, thus taking them off the open market.
If you notice a consistent decrease in outstanding shares, it may indicate that the company is actively buying back its stock. On the other hand, if you see the number of outstanding shares going up quarter after quarter, it can mean that the company is issuing stocks to finance its activities. Nevertheless, an increasing number of outstanding shares is not always a red flag — especially if the company is relatively new.
Adding more information about the company
After taking care of the KPIs, the dashboard looked very minimalistic, so I decided to add just another source of data, with some basic company information — name, industry, current price, and P/E ratio.
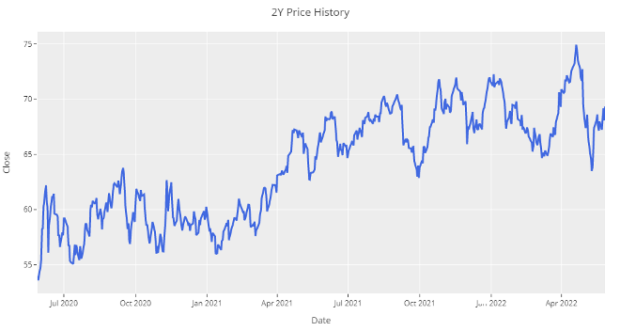
The last thing I will get is the historical price of the stock for the last two years. That way, I can see the price information side by side with the financial metrics.
You can get all these additional data points from yfinance as well! Look for the cells at the end of the notebook and I left some code there that you can use.
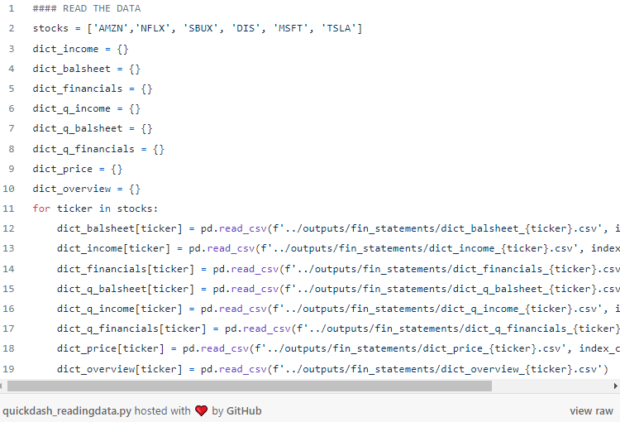
Reading the data
Feel free to start with the files provided in the repository and read all the data with the following code. I also included the files with quarterly figures (notice the “q” in the dictionary name), but we will only use the annual for this example.
Creating the dashboard page
Now that we have all the information we want to display, it’s time to get all the charts together on one page.
We will use Dash for this. A simple Dash app with a single page will be more than enough, and I’ll add a dropdown menu so I can select each stock.
I already published a few tutorials with Plotly and Dash, so if you are new to these tools, consider checking them out.
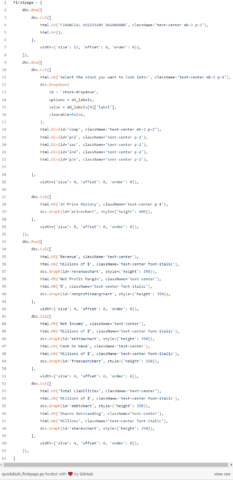
Layout — Rows and Columns
Every app needs a layout. In the image below, you can check how we will split it.
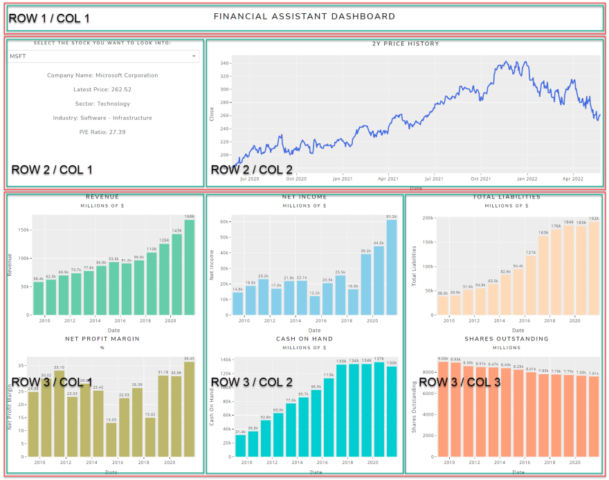
For future reference, remember that when you are creating the layout, “columns are placed inside rows”, and not the other way around.
If I just wanted to create all the slots for our charts, the code below shows you what it would look like. Notice the three rows, and each column clearly identified. Each column is waiting for the elements to be added.
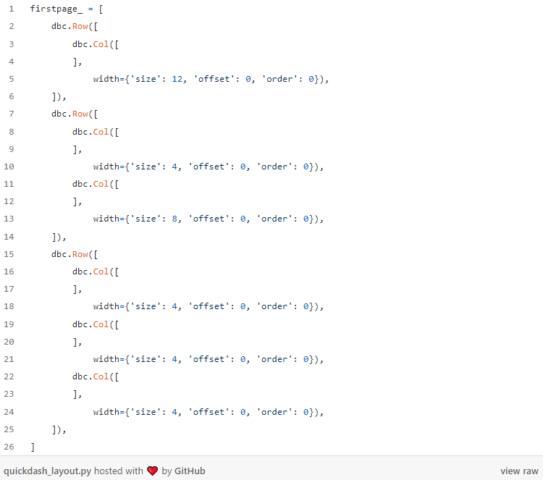
The total width for a page is 12, so we want to make sure the columns respect that limit, otherwise the charts will move to another row and it will not look good!
Adding the charts
Once we have all the data we need to create the charts, it’s time to actually create them with Plotly Express. Below you see the code for two charts, just as you find them in the notebook: price history and the revenue.
Having all the charts on the page with the same color was really getting on my nerves, so I tried picking a different color for each one. Hopefully, we can all agree the end result looks better than a monochromatic page!
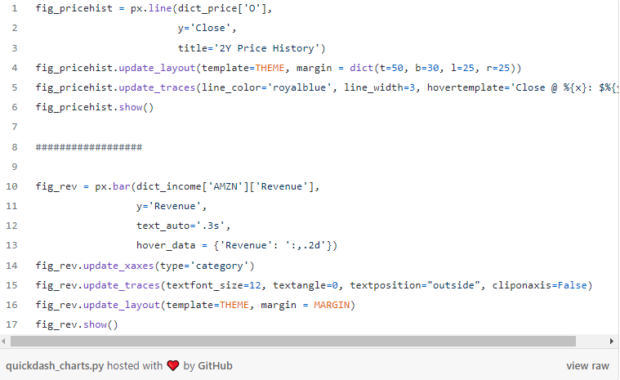
I also added some minor adjustments to the charts, like adding some labels and making sure the text looks uniform.
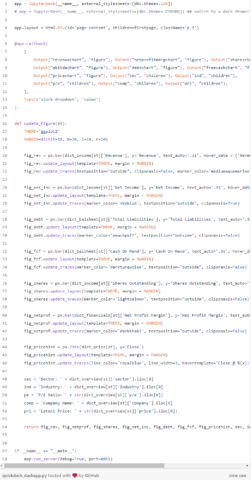
Here’s what the dashboard page looks like when you add all the elements like headers, paragraphs, a dropdown menu, and the charts can be placed in the Graph elements.
Pay attention to the Graph elements “id” argument. It is going to be crucial in order for the callbacks to work correctly when updating the chart with the dropdown menu.
A simple but long callback
If you just started coding, it’s reasonable you do not know what a callback is. I sure didn’t until I had to use one!
The theory behind callbacks is simple. When a specific element of the page changes, an action is triggered — or called.
In our case, we want the charts and company information to update when the user selects a new value in the dropdown menu. That takes care of the input part of the callback.
Our output is going to be big, and we have several different elements to update and return. That’s what the function below is doing. Whenever the input (new stock ticker in the dropdown menu) is passed, the function will generate all these charts and stings. Below all that, you can see that it returns everything as well.
Make sure the order of the returned items is the same as the outputs!
If this callback is taking the best of you, I suggest you check out an easier example in the video below.
Using the dashboard and adapting it
Congratulations if you made it this far! You should now be able to go through your favorite stocks and quickly get a sense of how they are doing and what you need to do next.
Some metrics are simply personal preferences, but you should be able to quickly replace them with your own. You can also include additional charts or resize them, change the themes, etc.
Plotly Express gives you a lot of functionality out-of-the-box and I have a free Plotly crash course available if you are interested! There I also teach you about Plotly Graph Objects, which lets you customize your charts even further.
If you want to take your dashboarding skills to the next level, I recommend checking out my advanced course with Plotly and Dash! As an added bonus there, you’ll get a few of my own custom functions to scrape market data and also calculate the market value of your portfolio day by day.
Thank you for reading! As always, I welcome feedback and constructive criticism. If you’d like to get in touch, you can contact me here, tweet, or reply to the article below.