

If you are a blogger like me, you would understand the importance of valued added visuals, statistics & videos to an article. While the easiest way is to just “google” them, it would be much more convenient if you can find the data at one place & that is exactly what I am going to do here. If you have come across any of my other blogs, you would know that I post a weekly blog about the most content worthy infographics from my twitter feed for the past week on topics relating to Technology, Finance, Blockchain/Crypto, Jobs, Productivity, Fintech etc. I have decided to take this a step further & compile a list of infographics (from my twitter postings), which have important data driven statistics related to all the topics mentioned previously and publish them at the end of each month. This can become a useful source of data sets for the people looking for them. Hope you like them. Any feedback is welcome. The infographics for this month are in the following order.
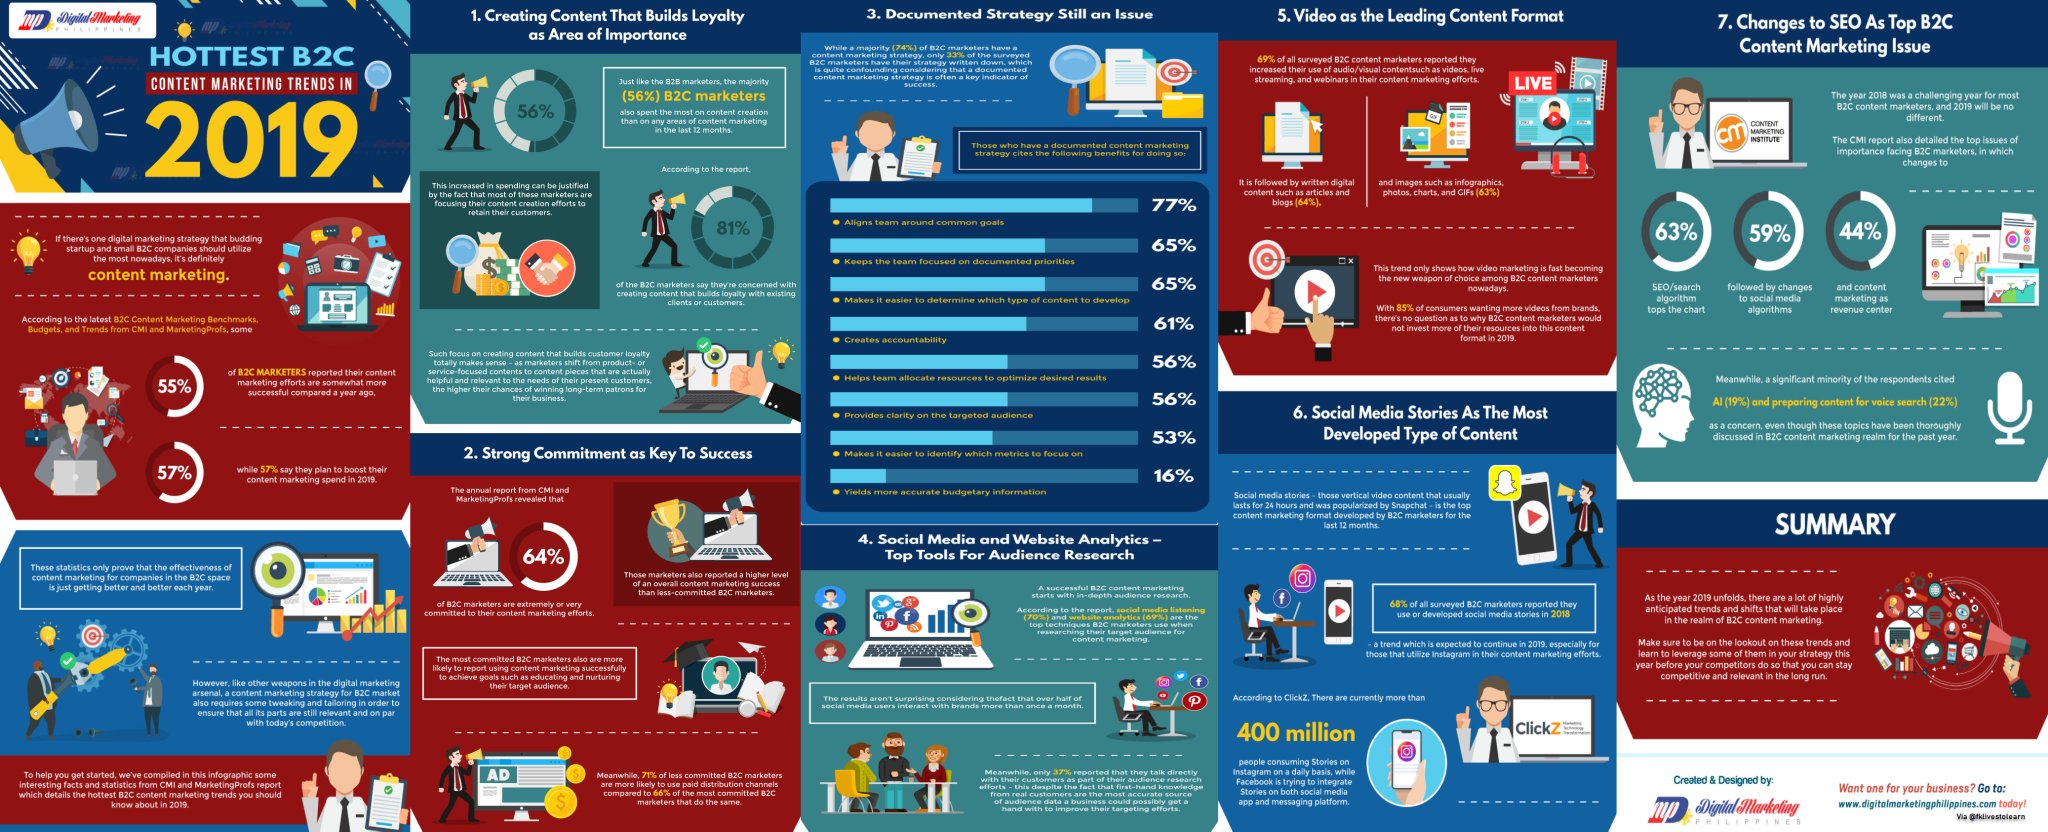
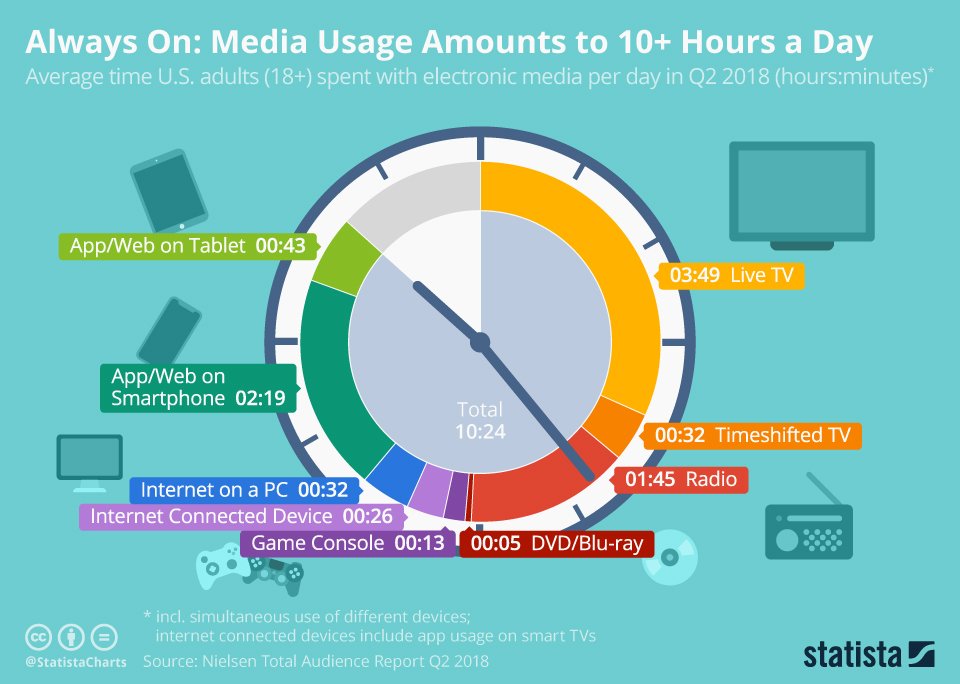
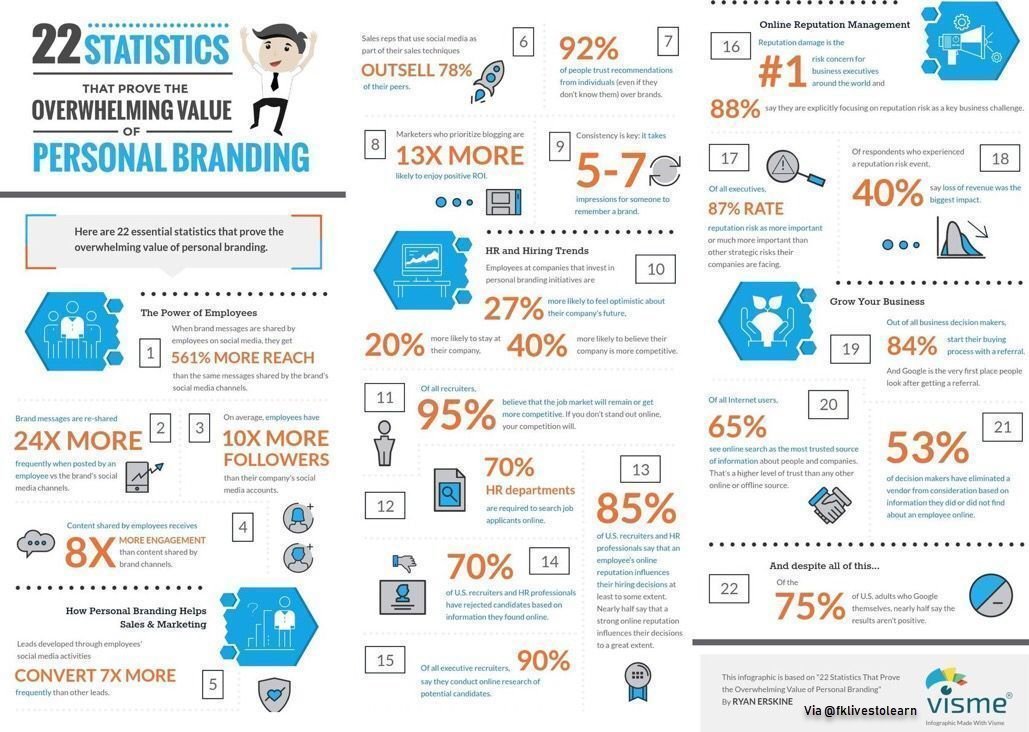
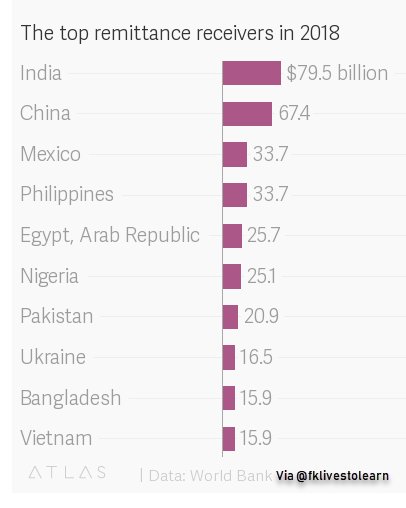
- Social Media, Digital Marketing, Content Marketing etc.
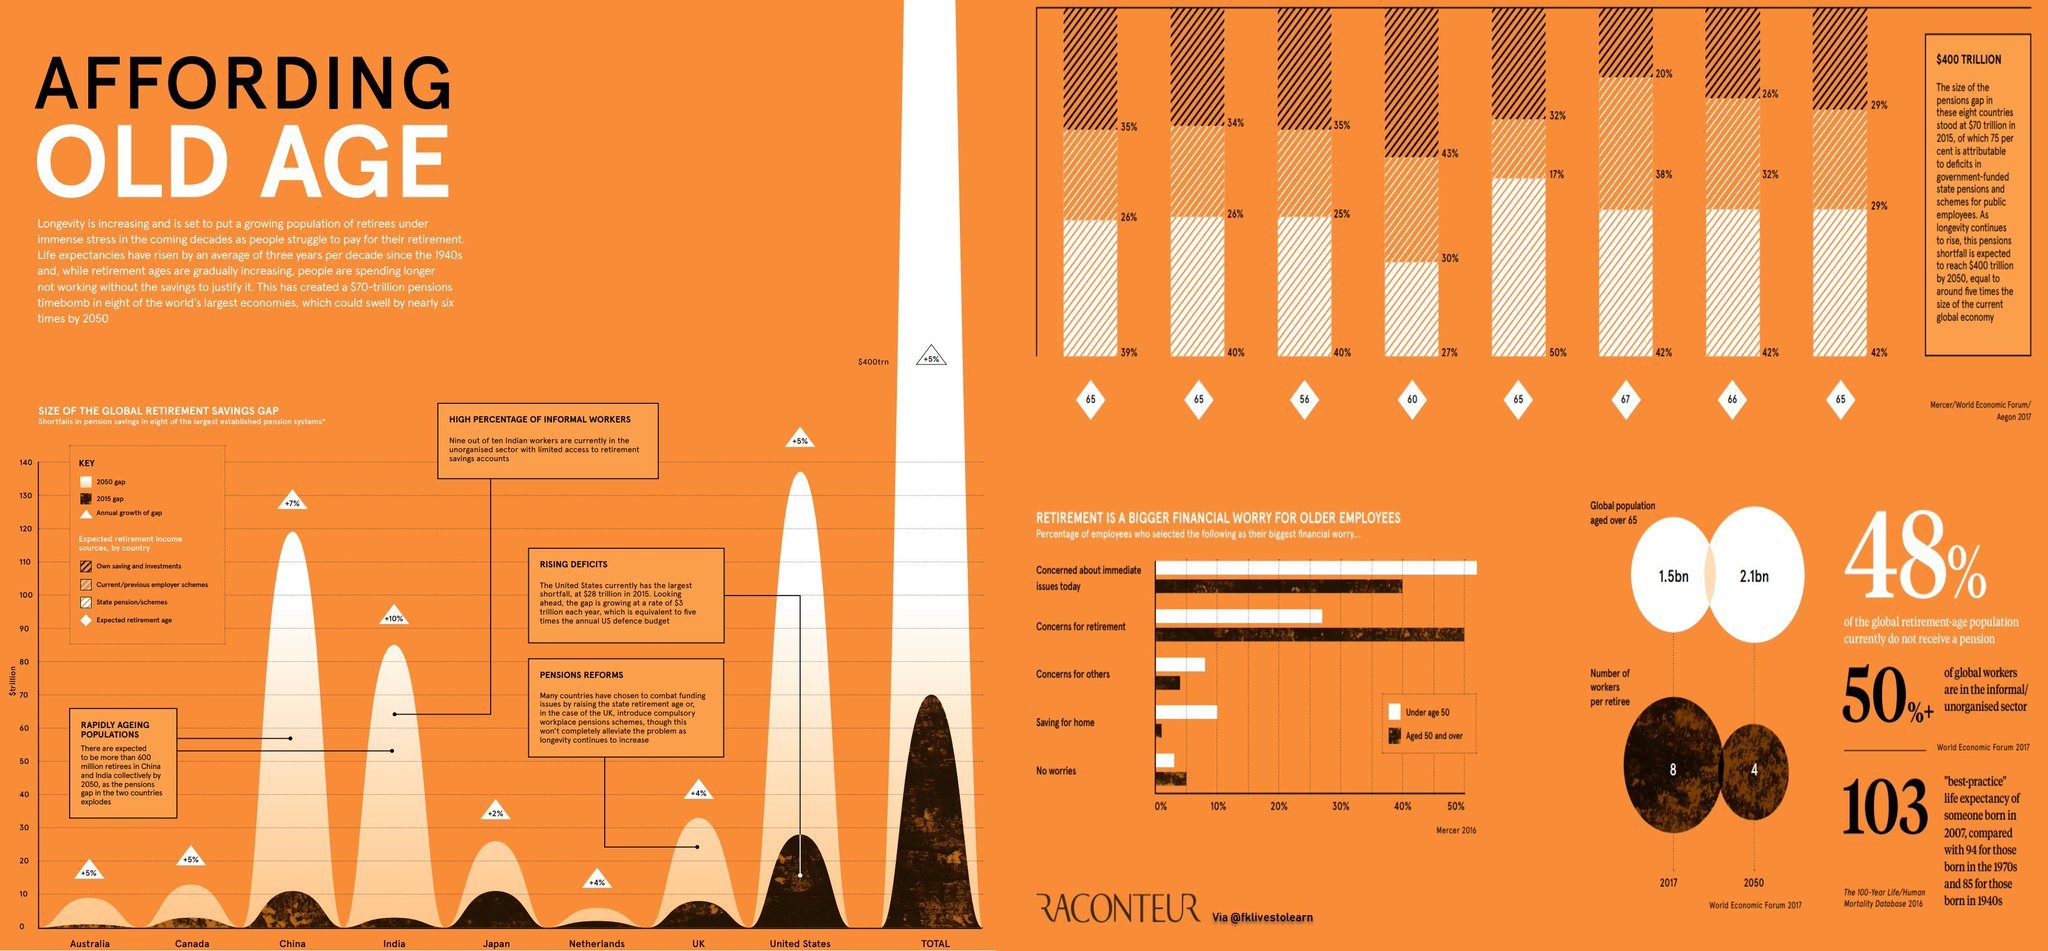
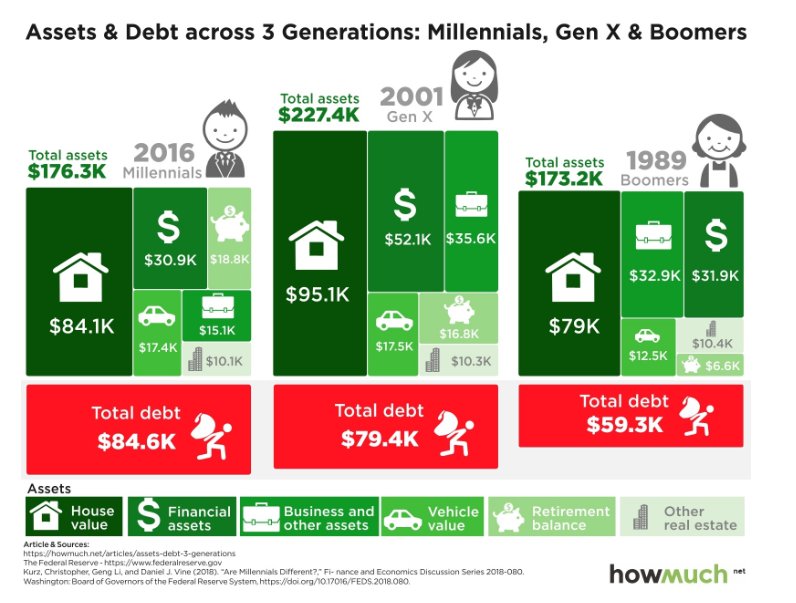
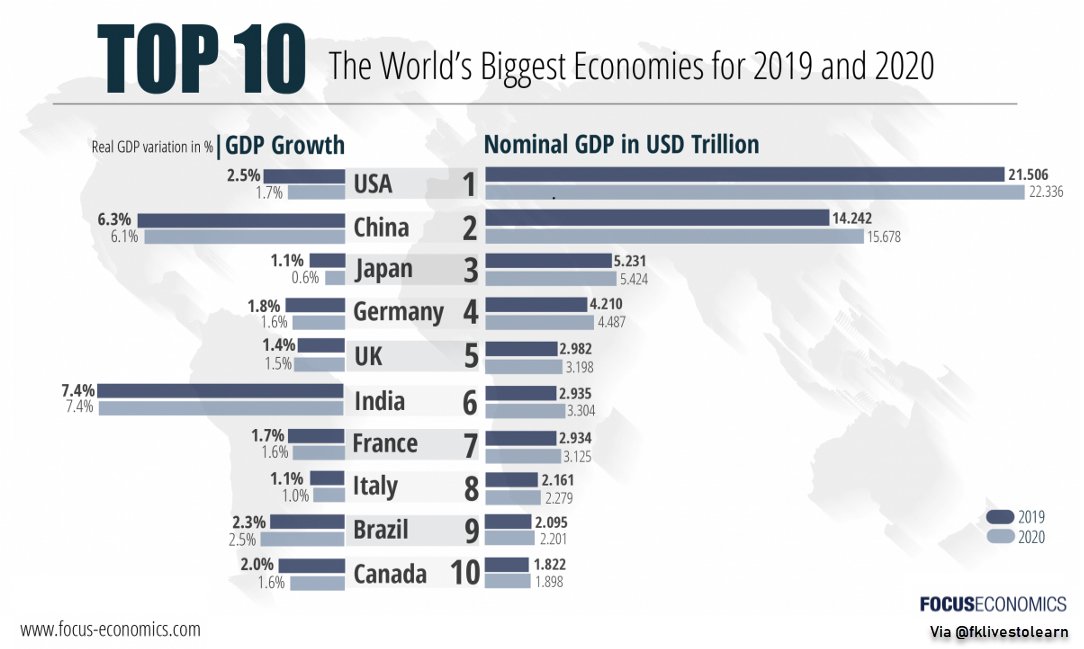
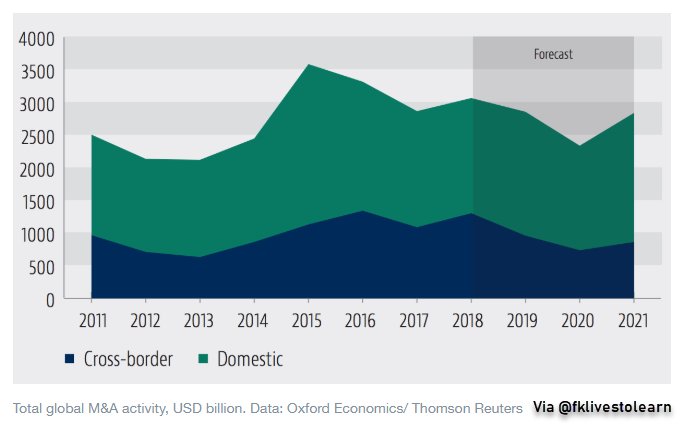
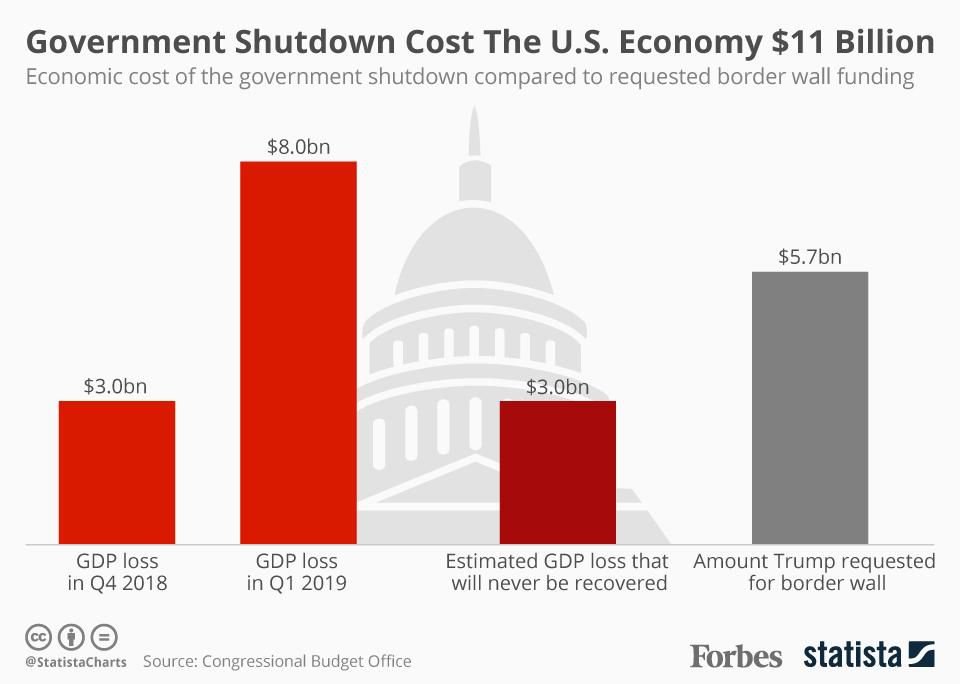
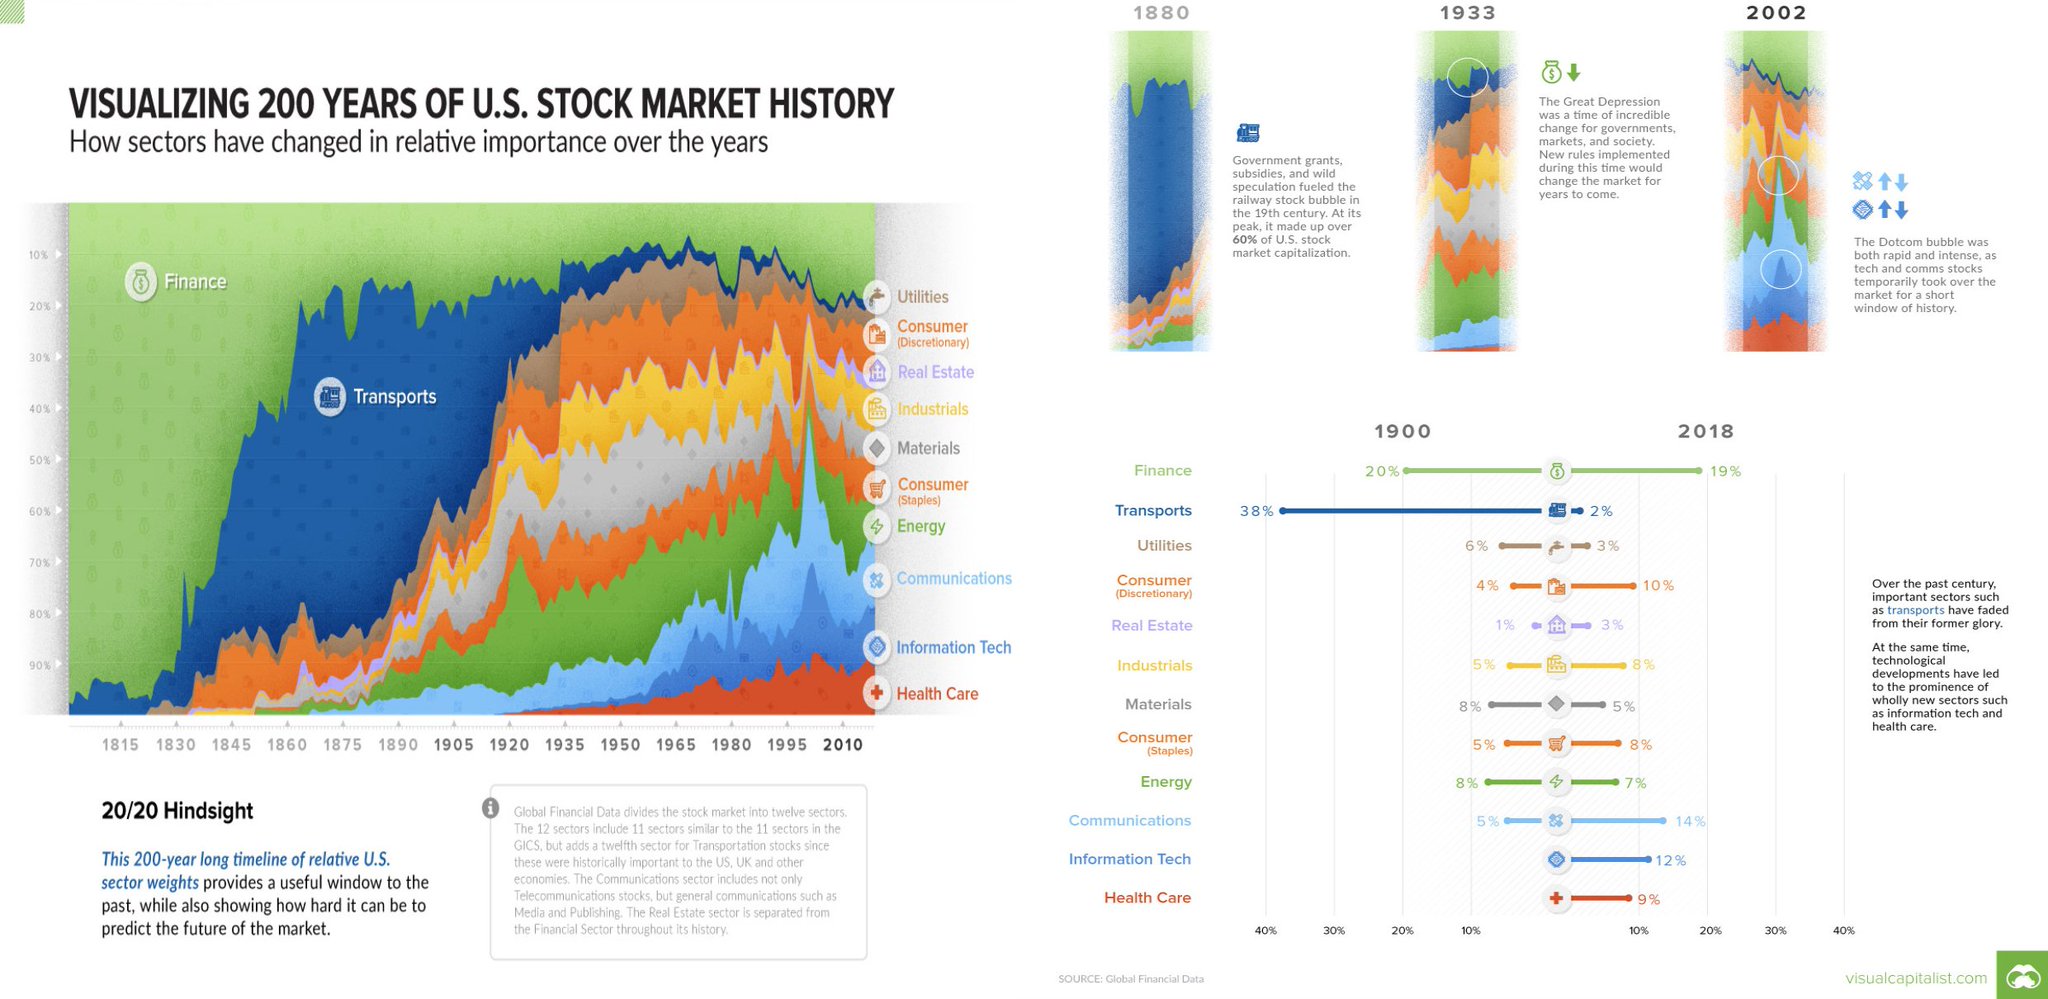
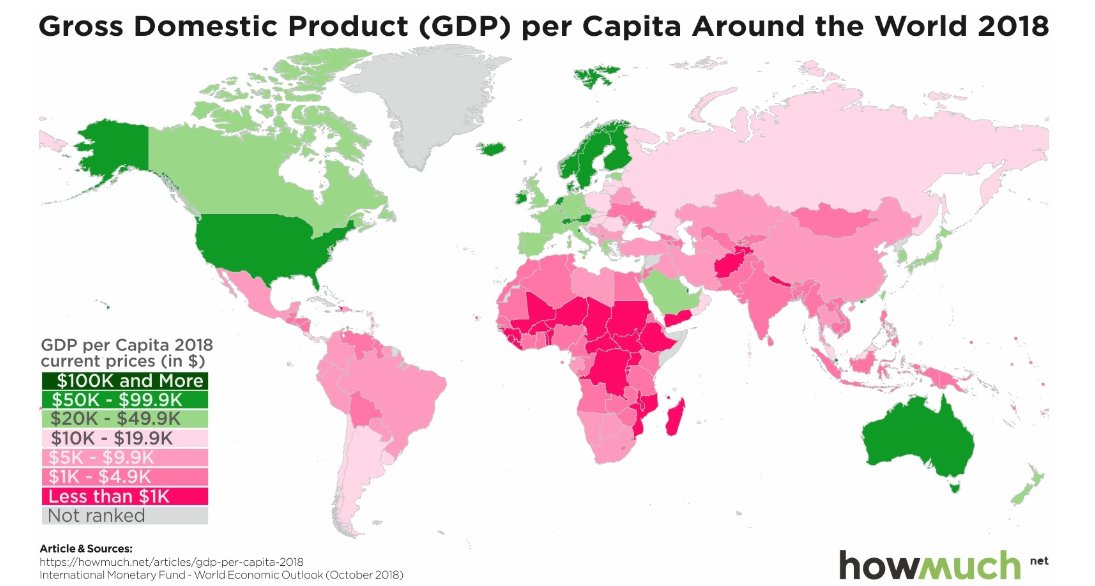
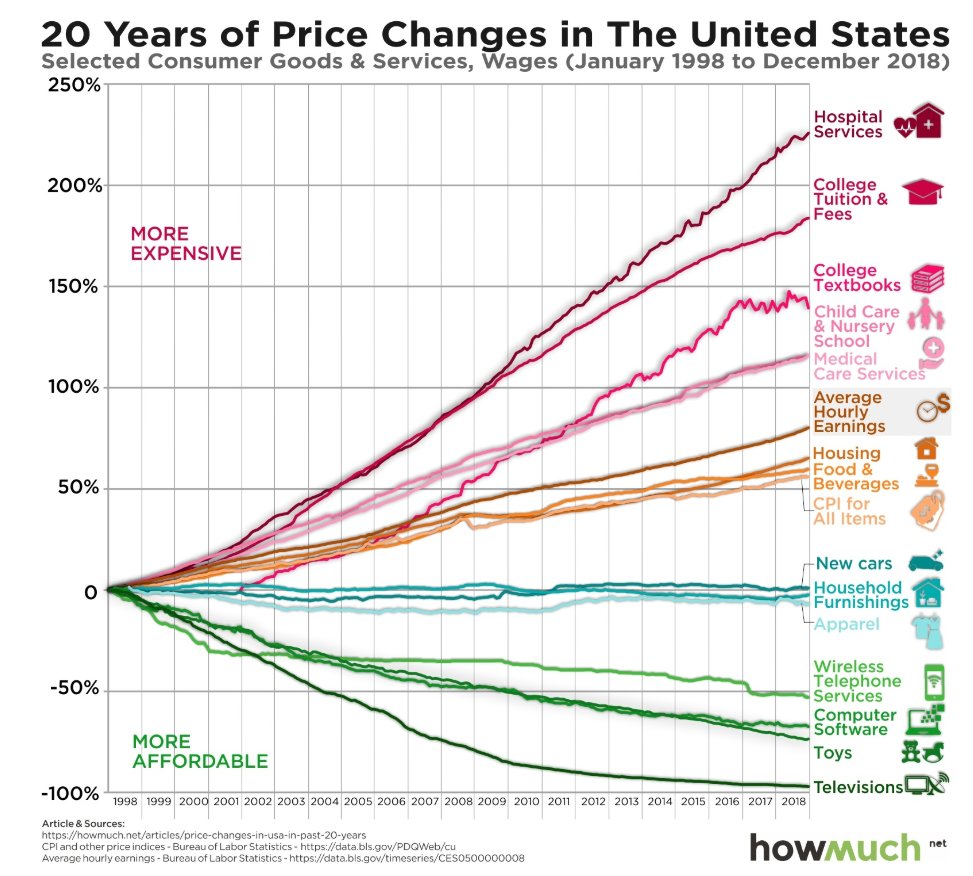
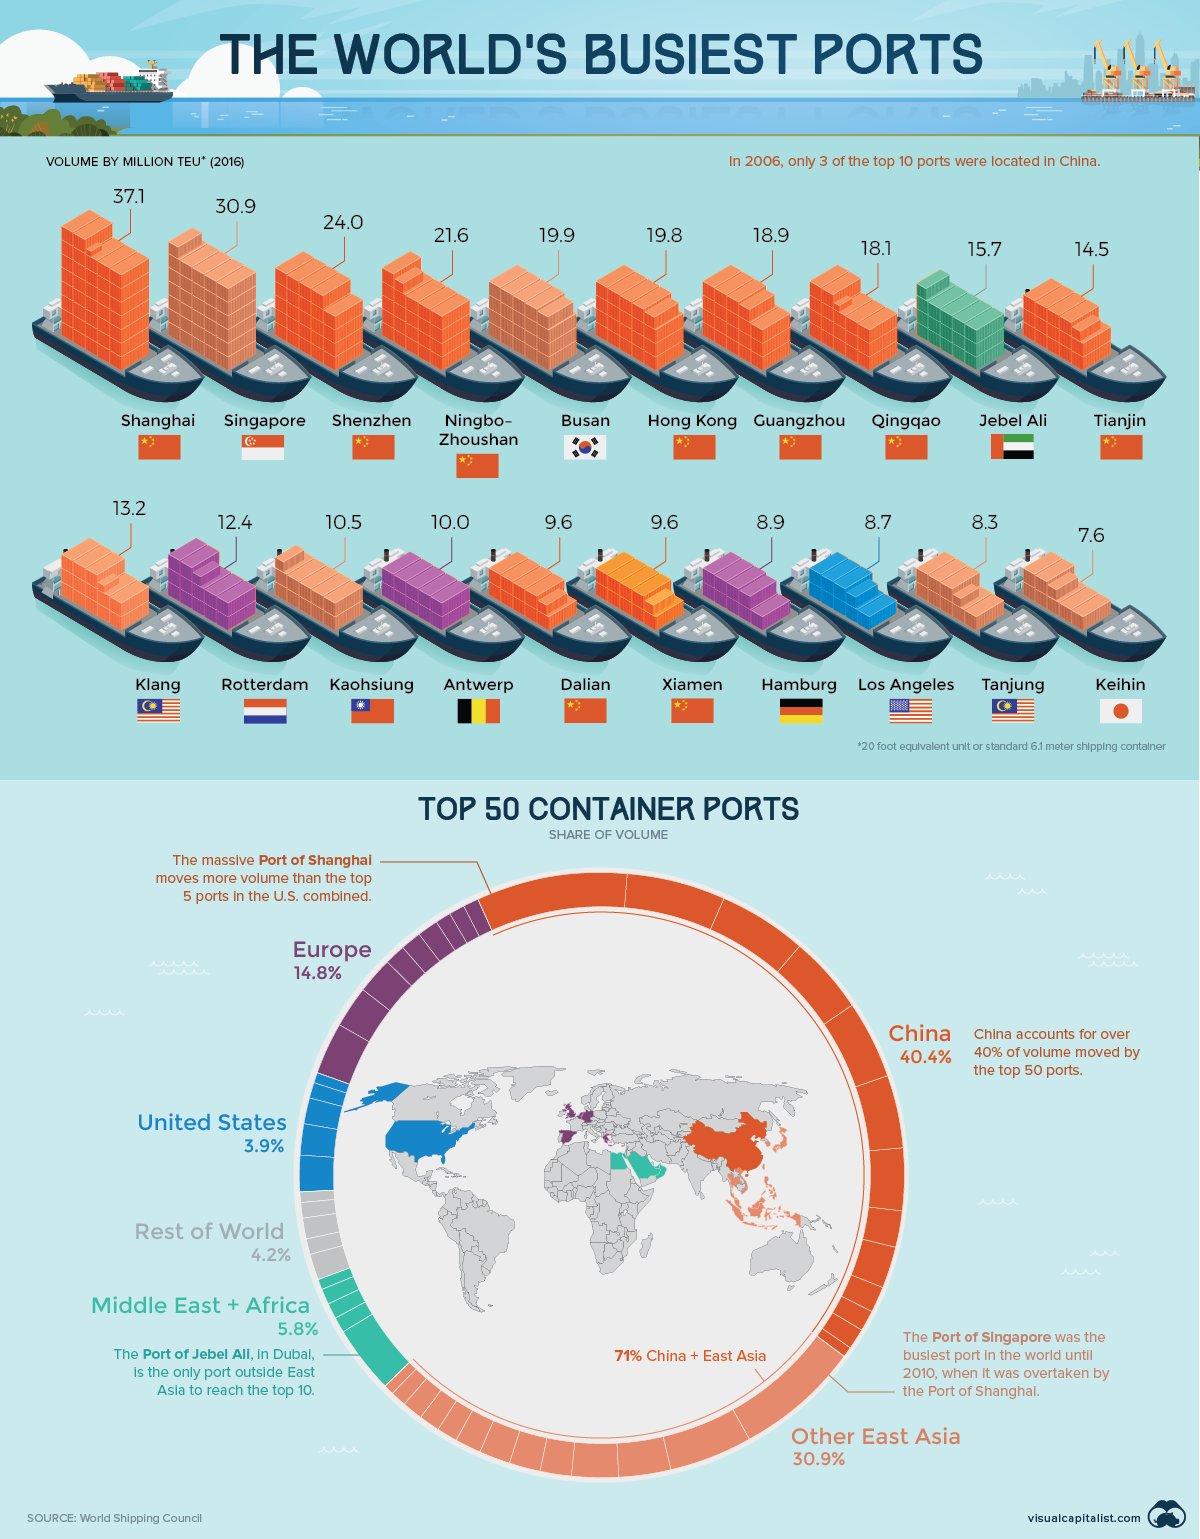
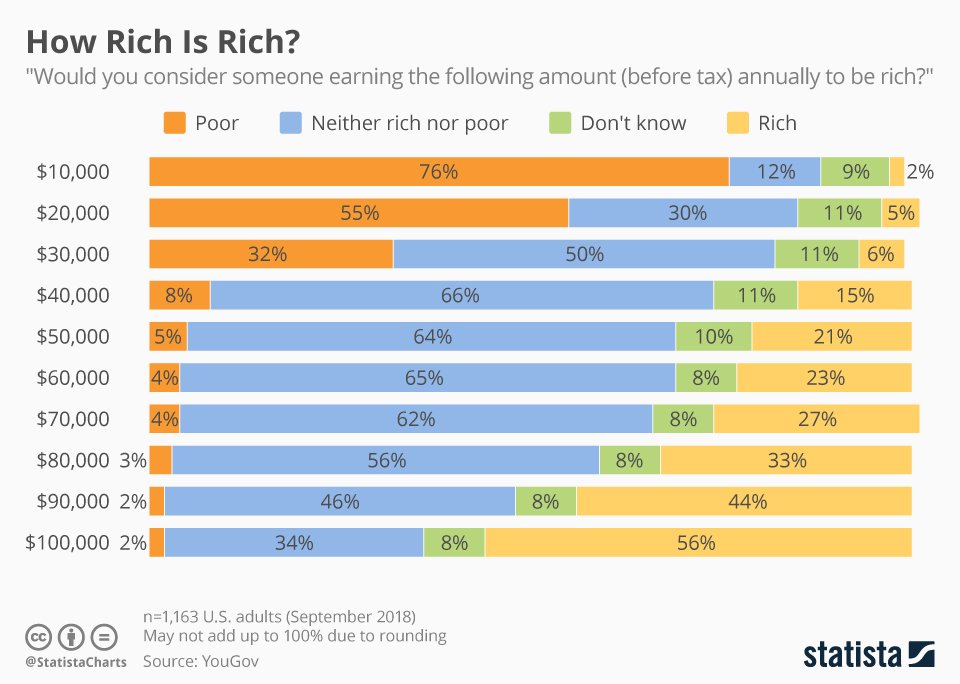
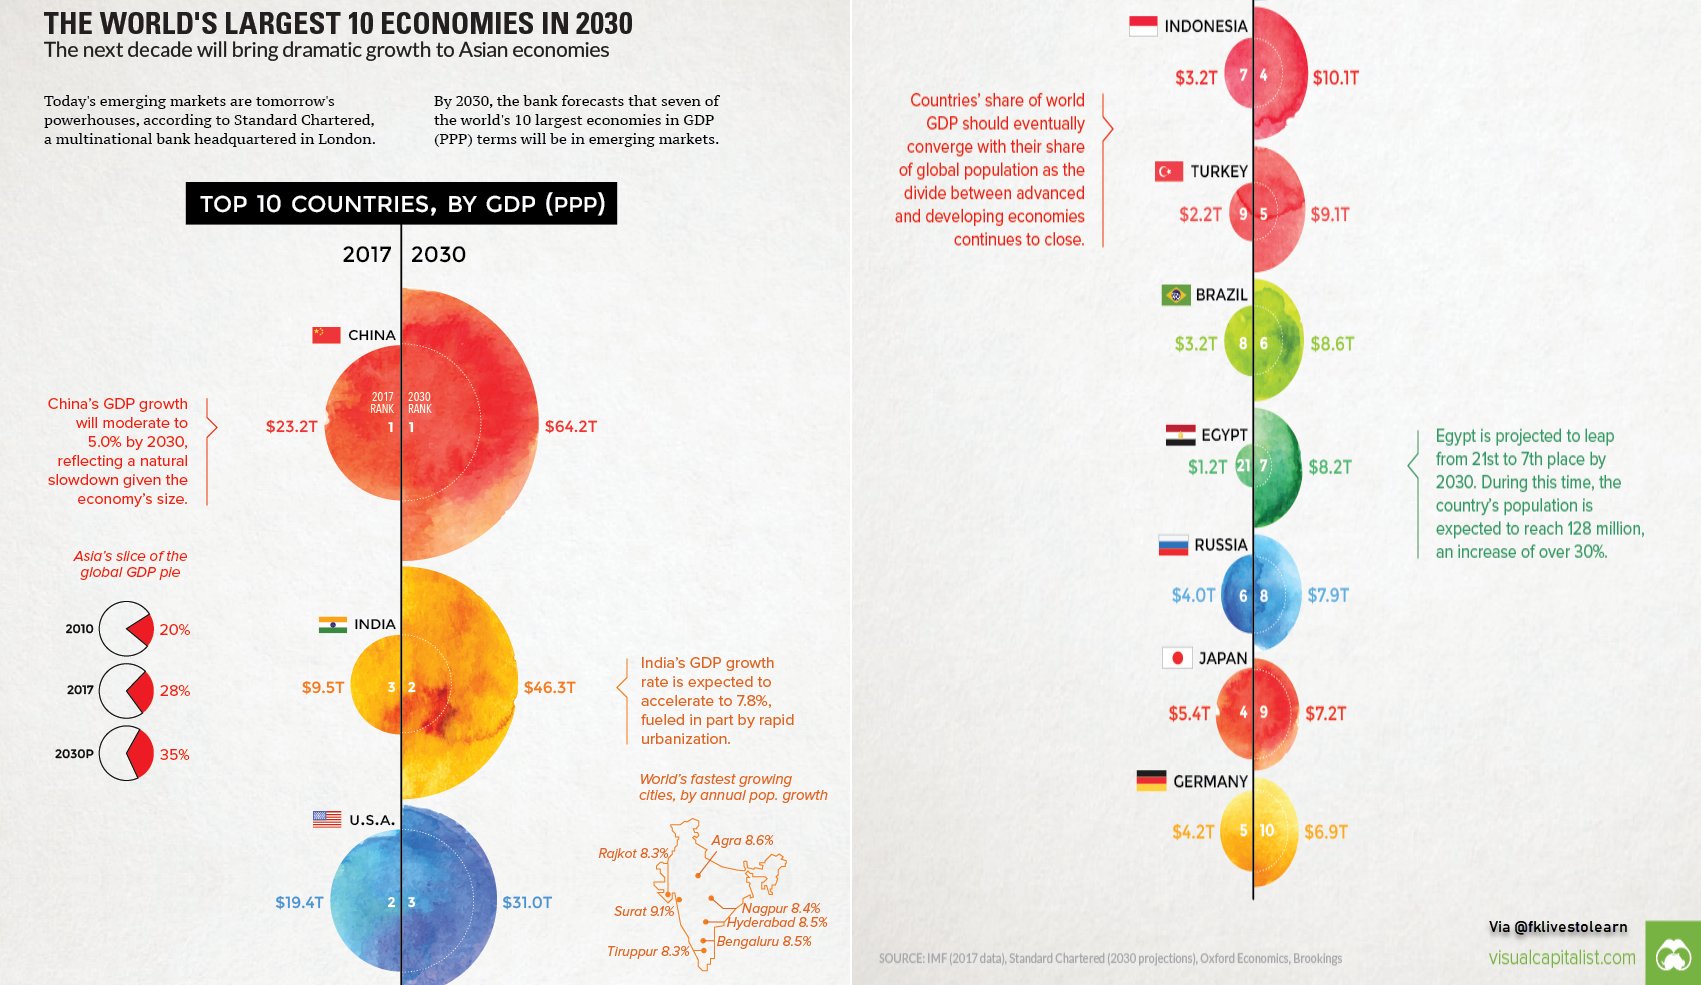
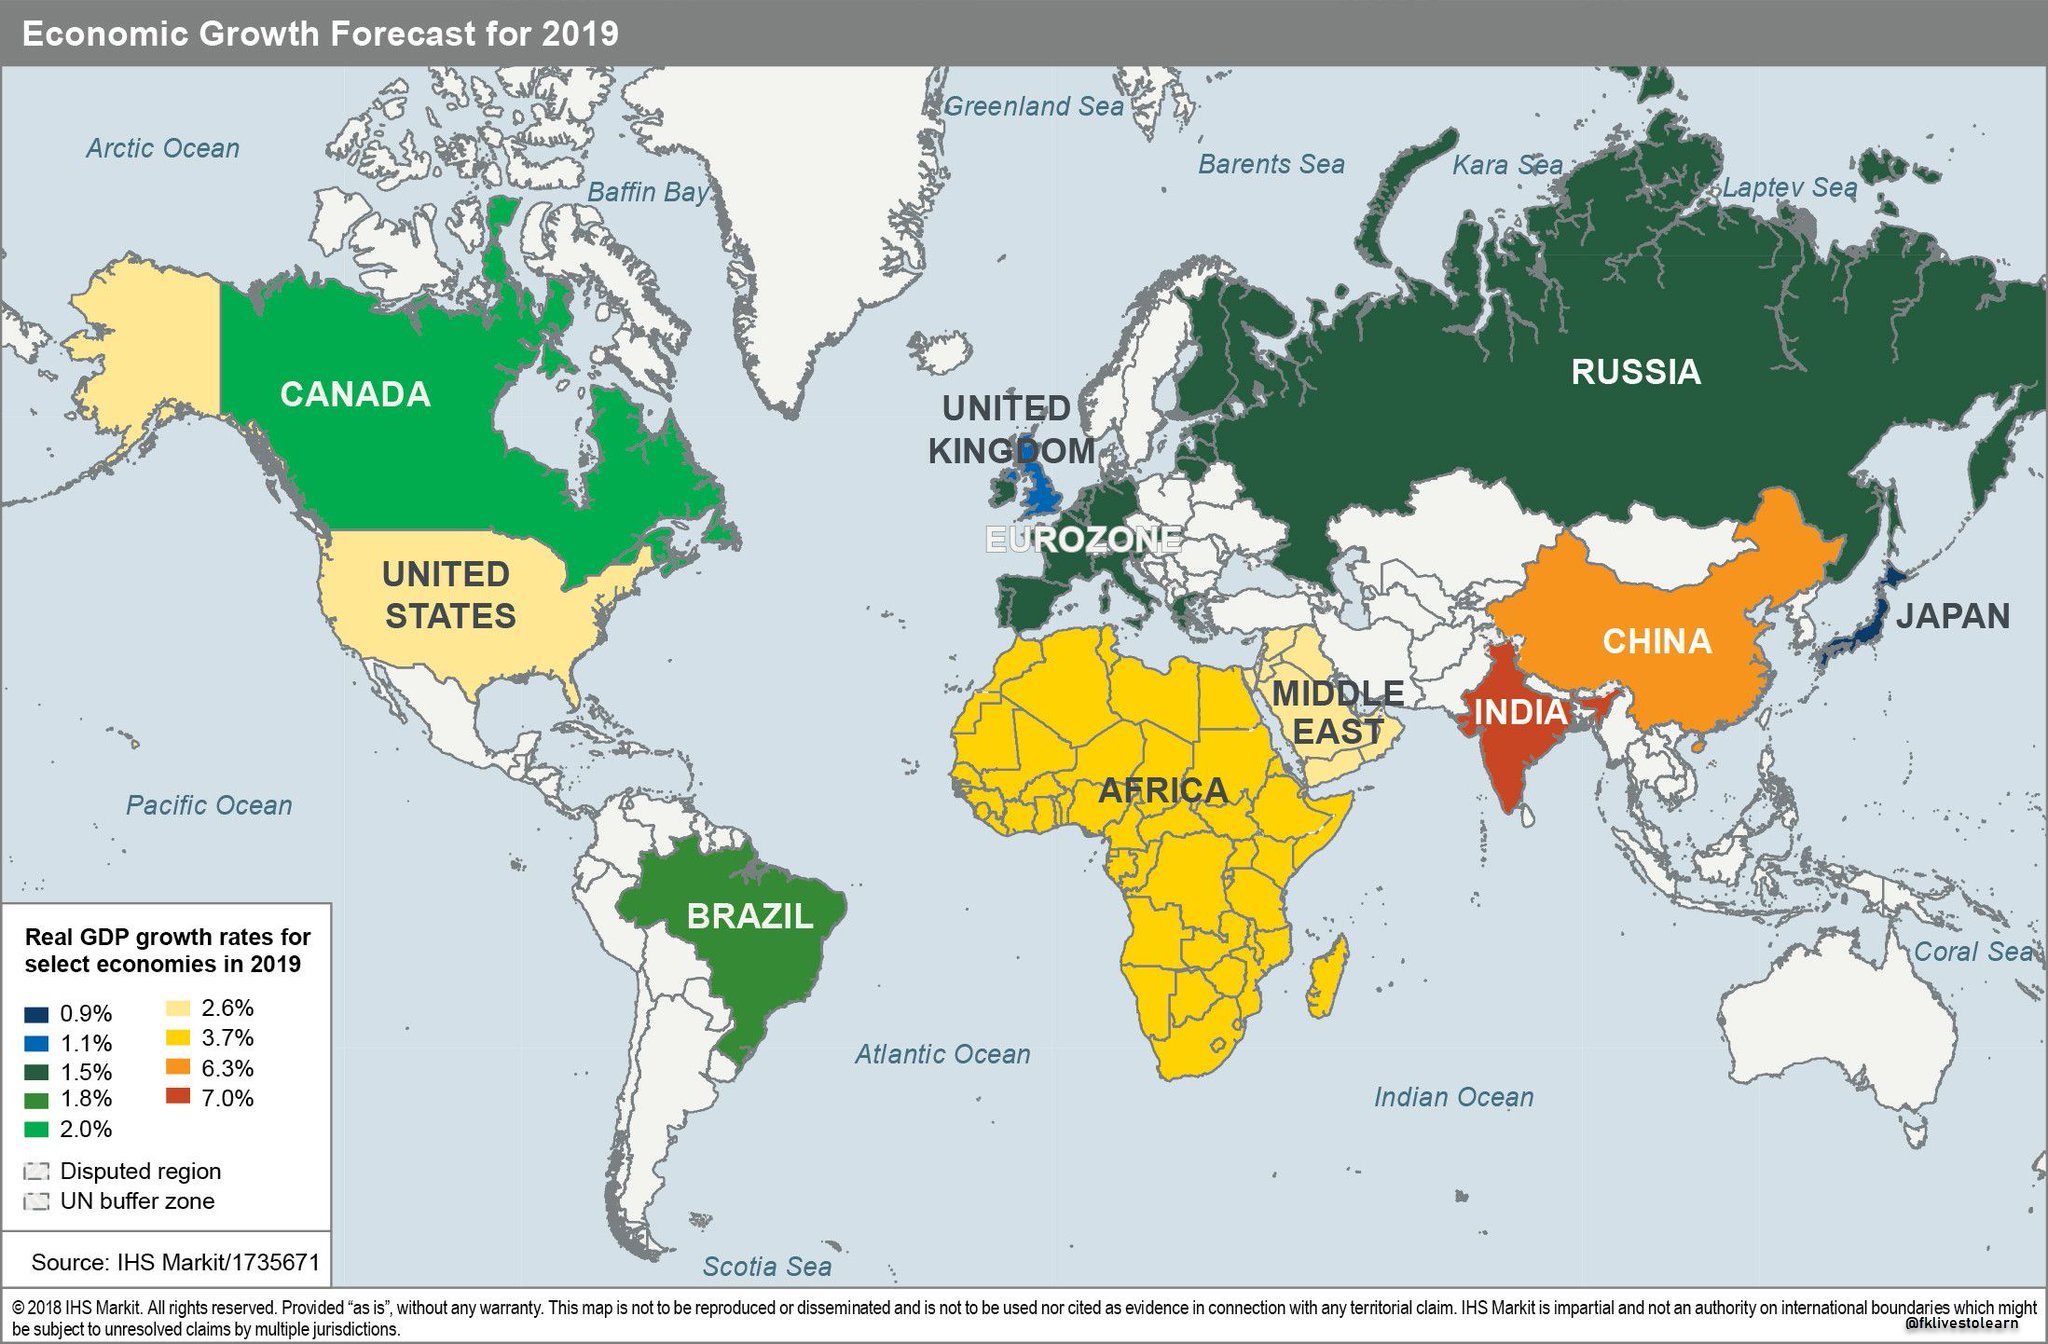
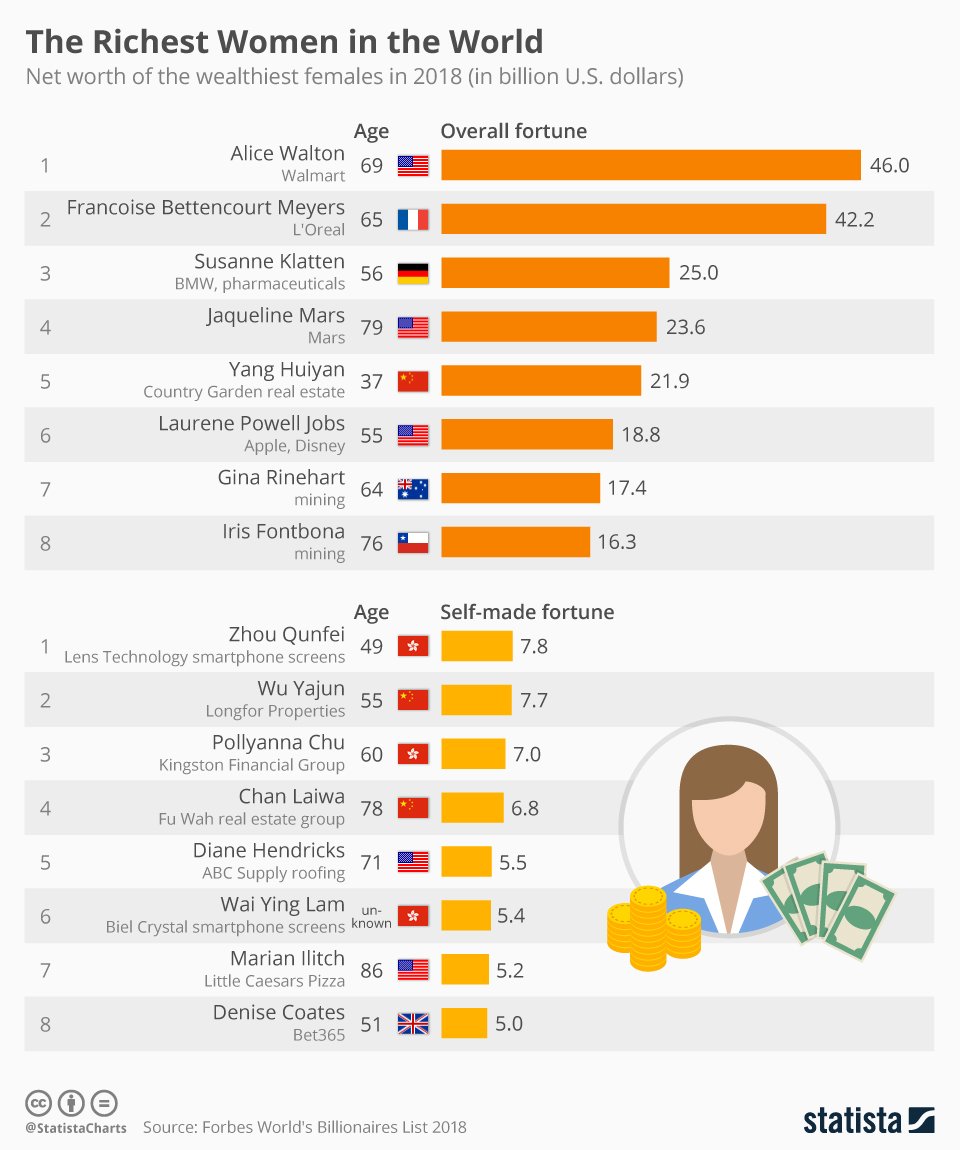
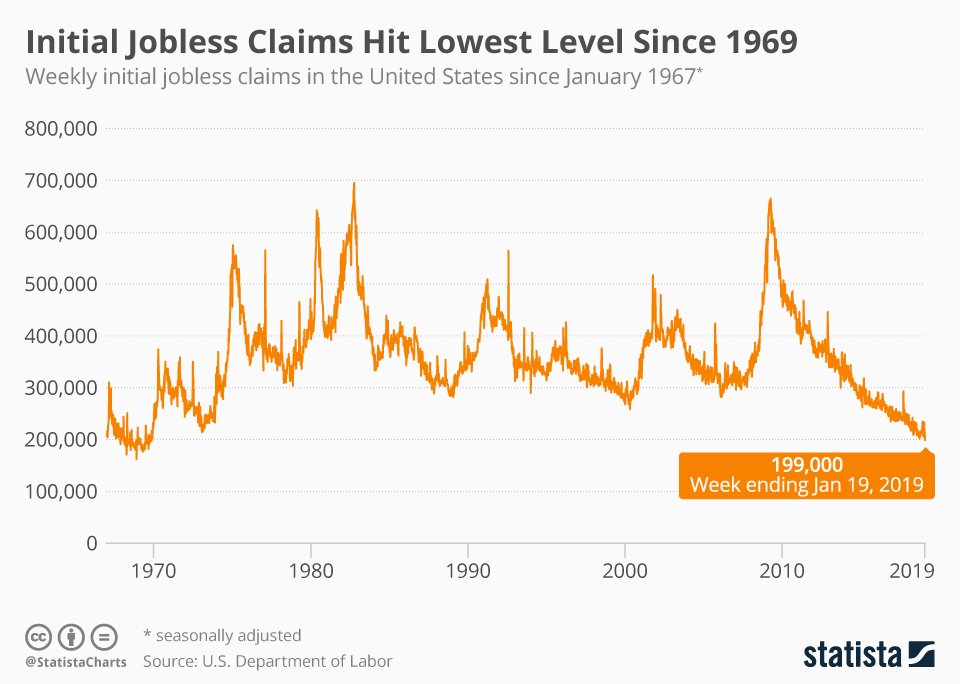
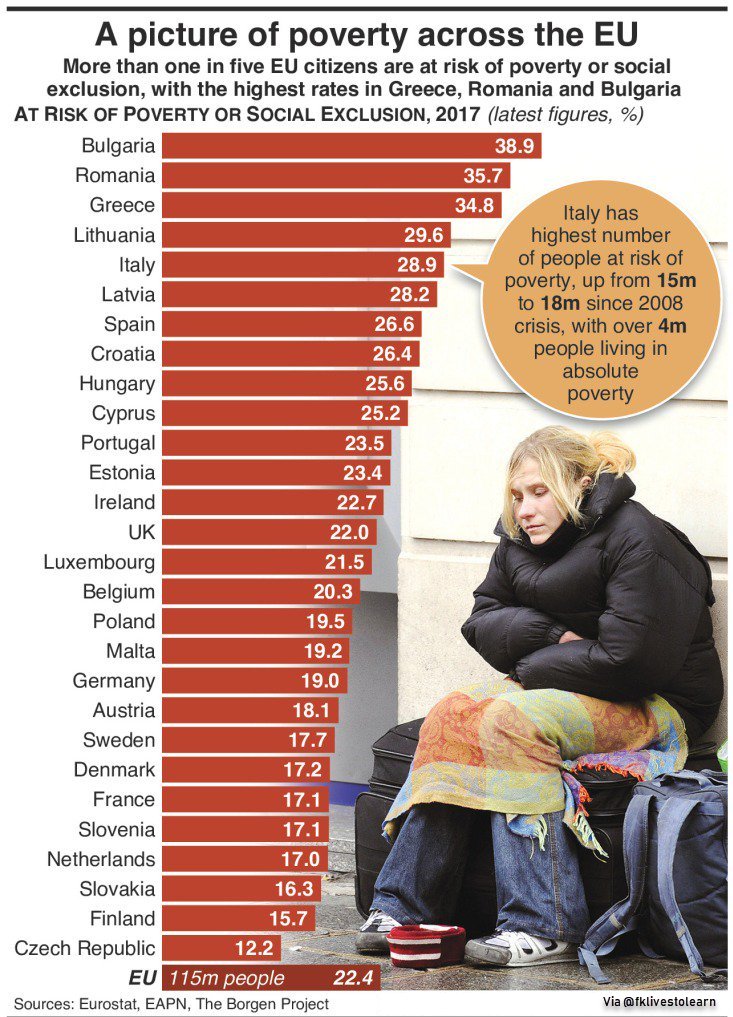
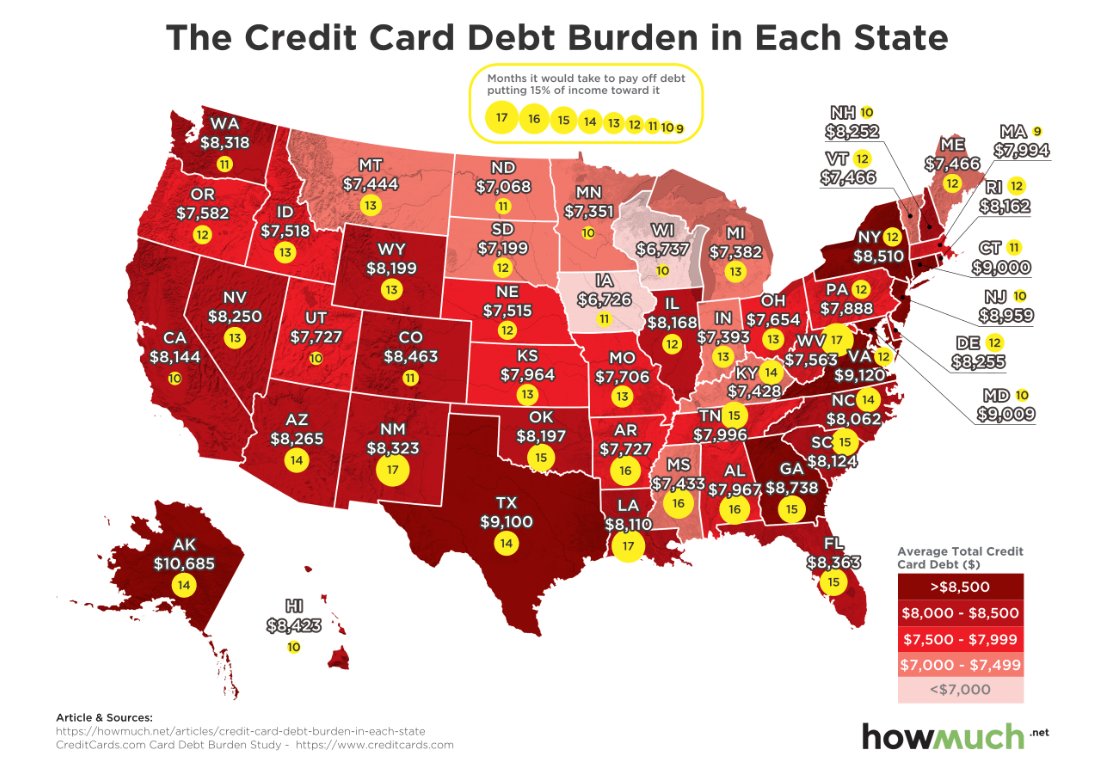
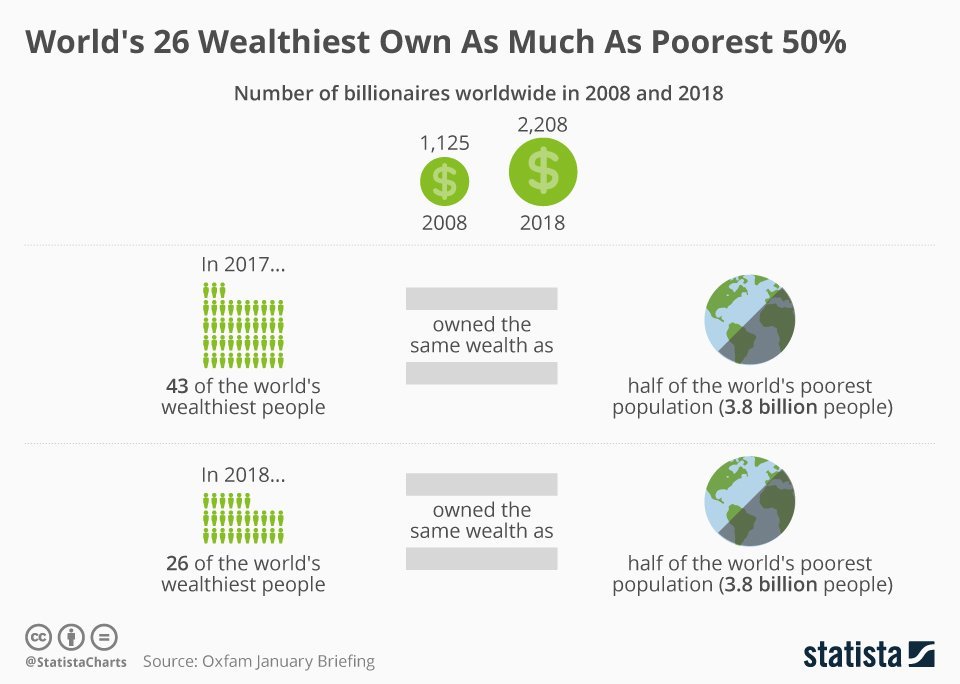
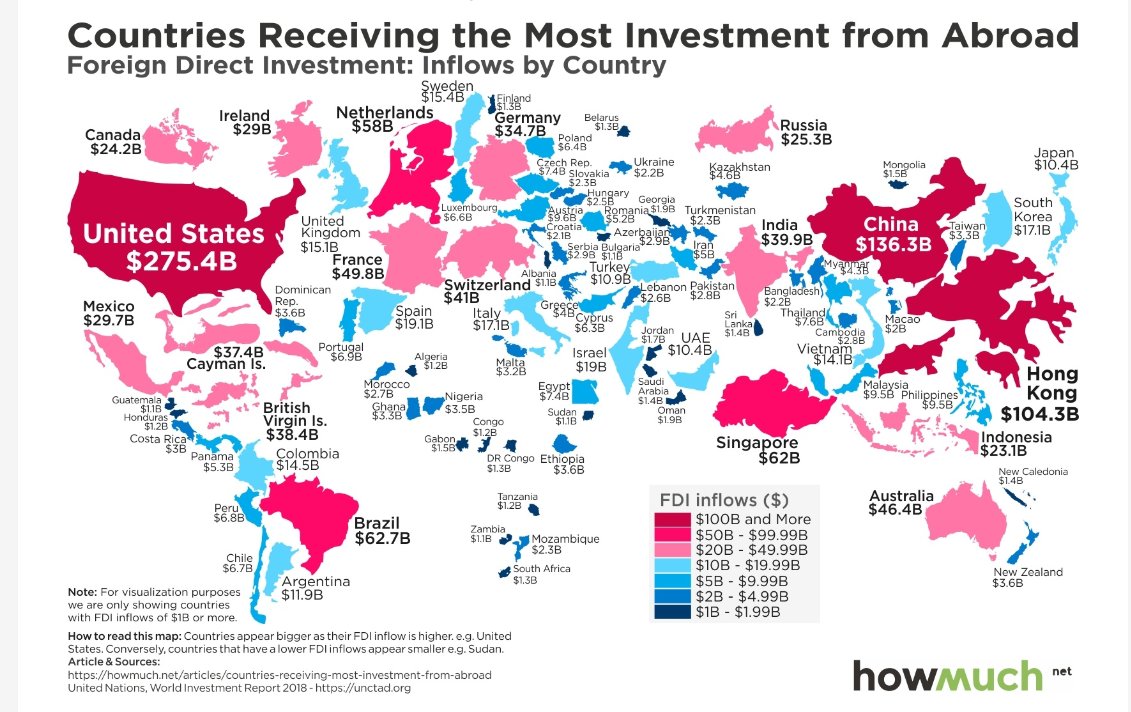
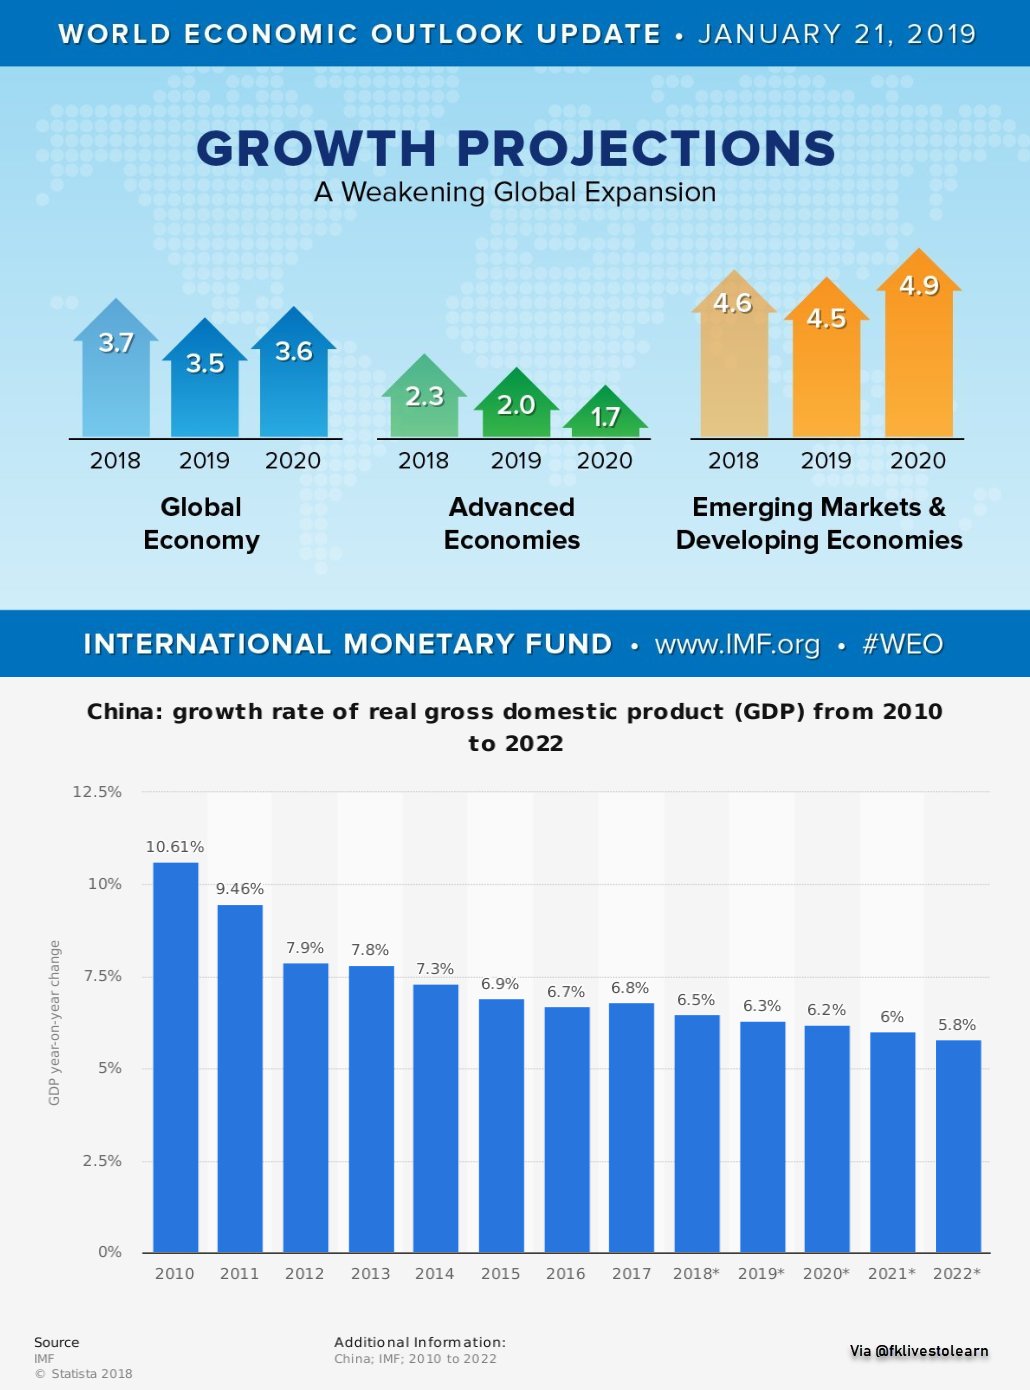
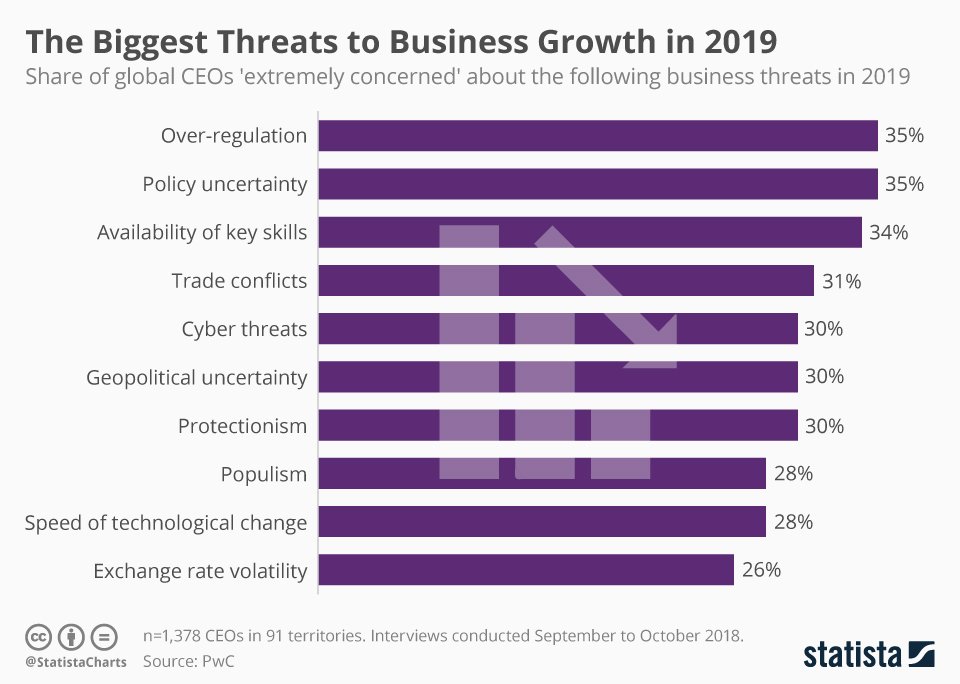
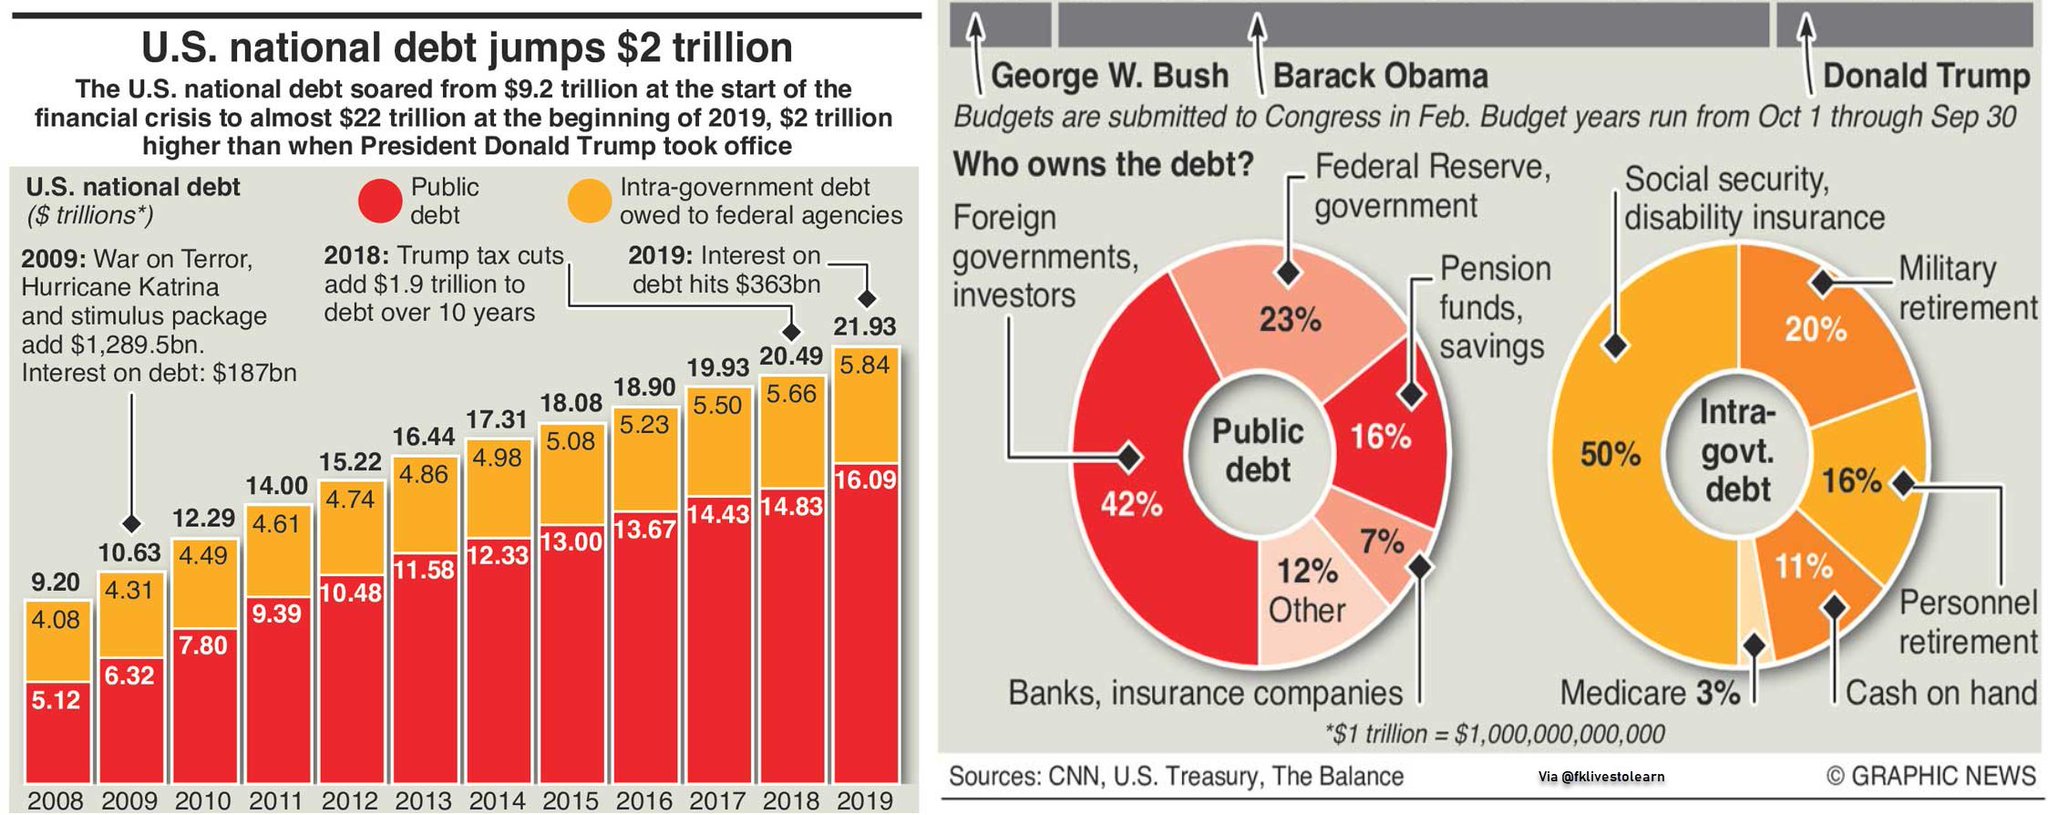
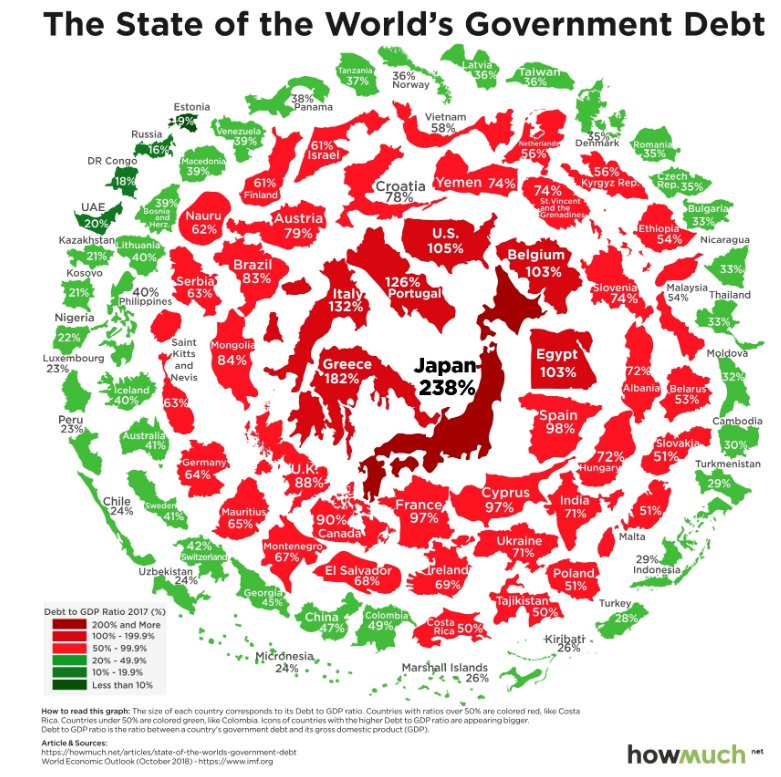
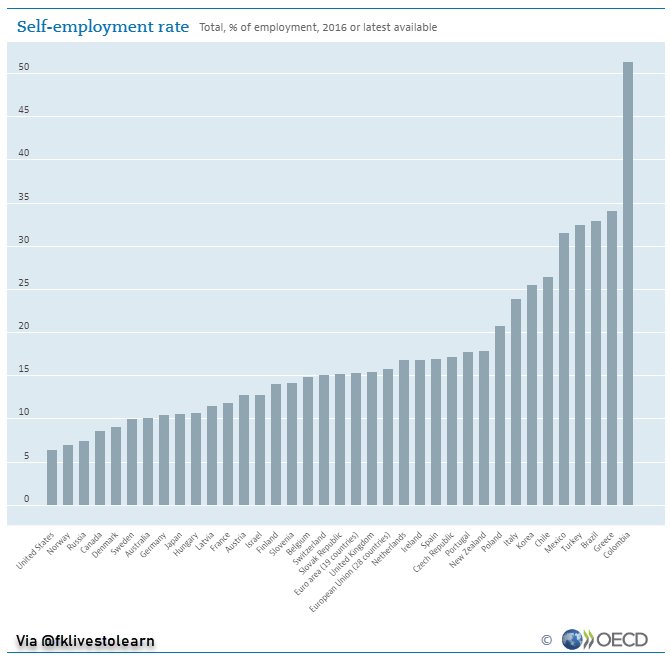
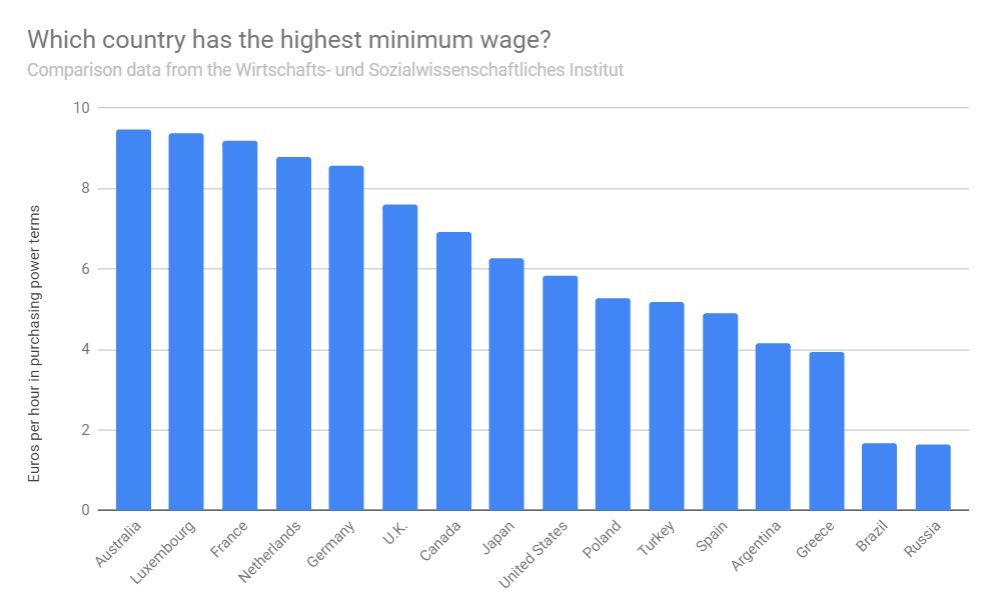
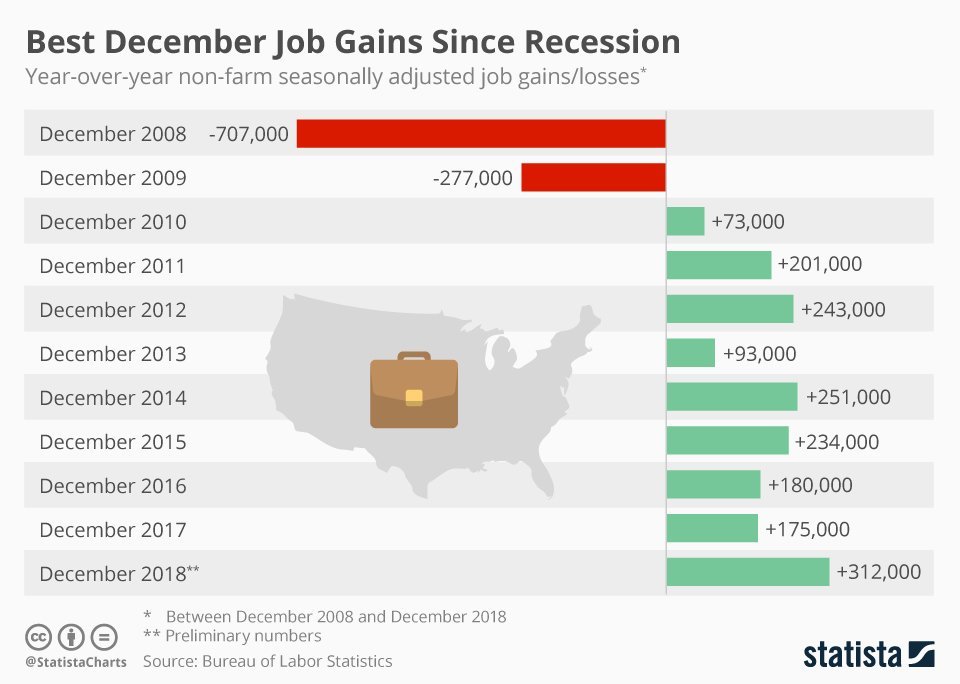
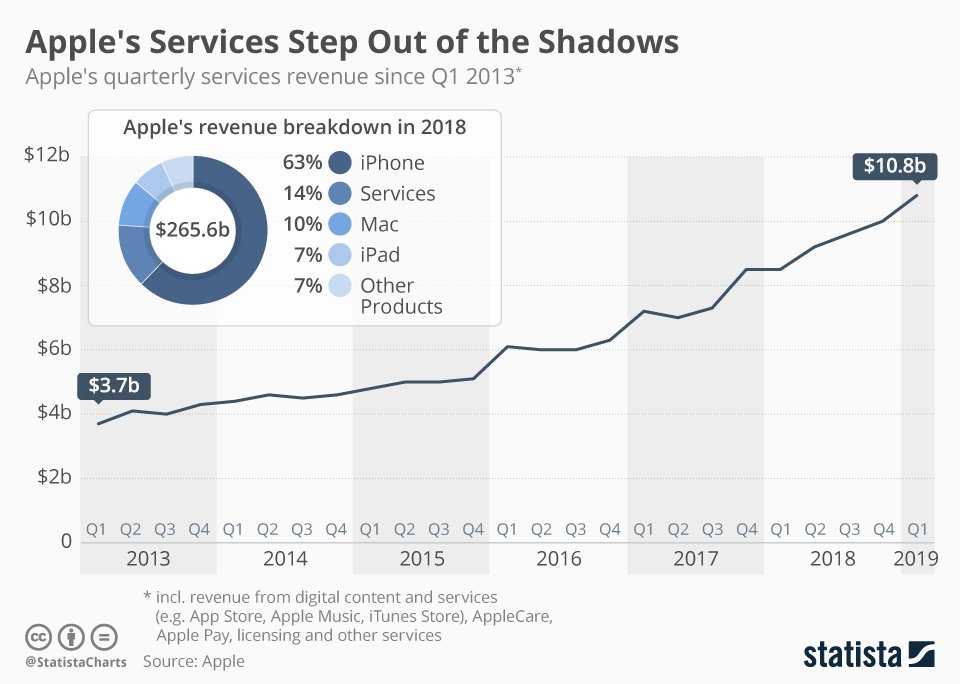
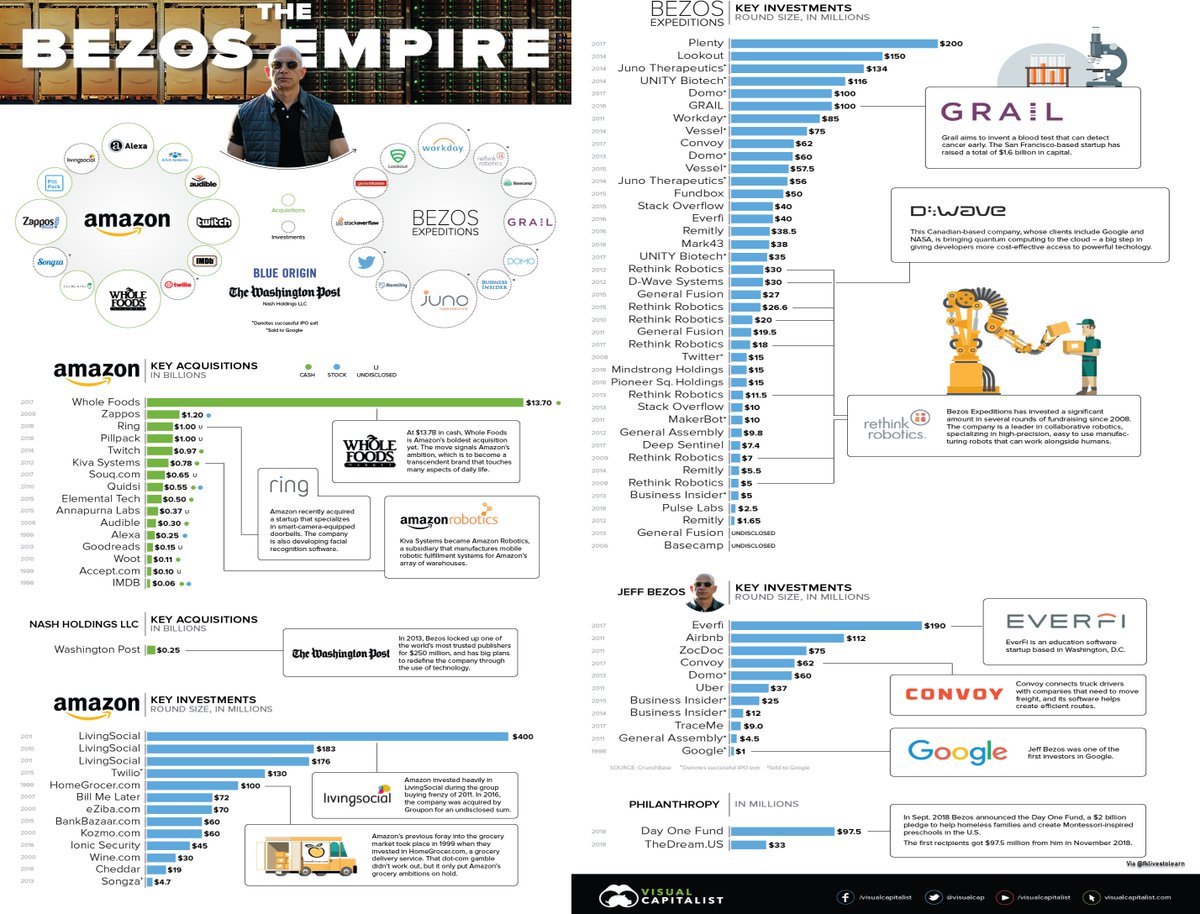
- Finance, Economy, Markets, Investing etc.
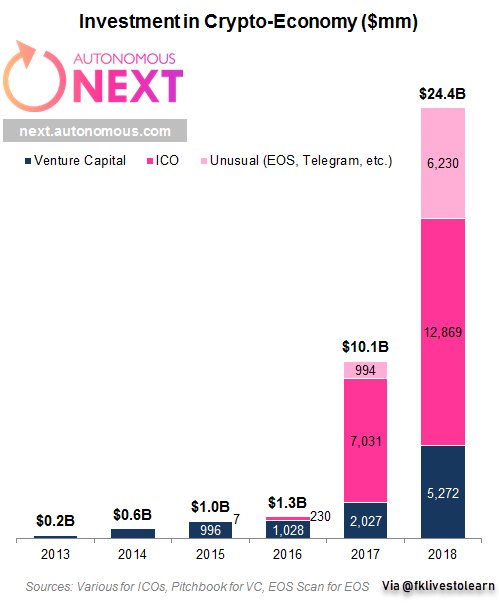
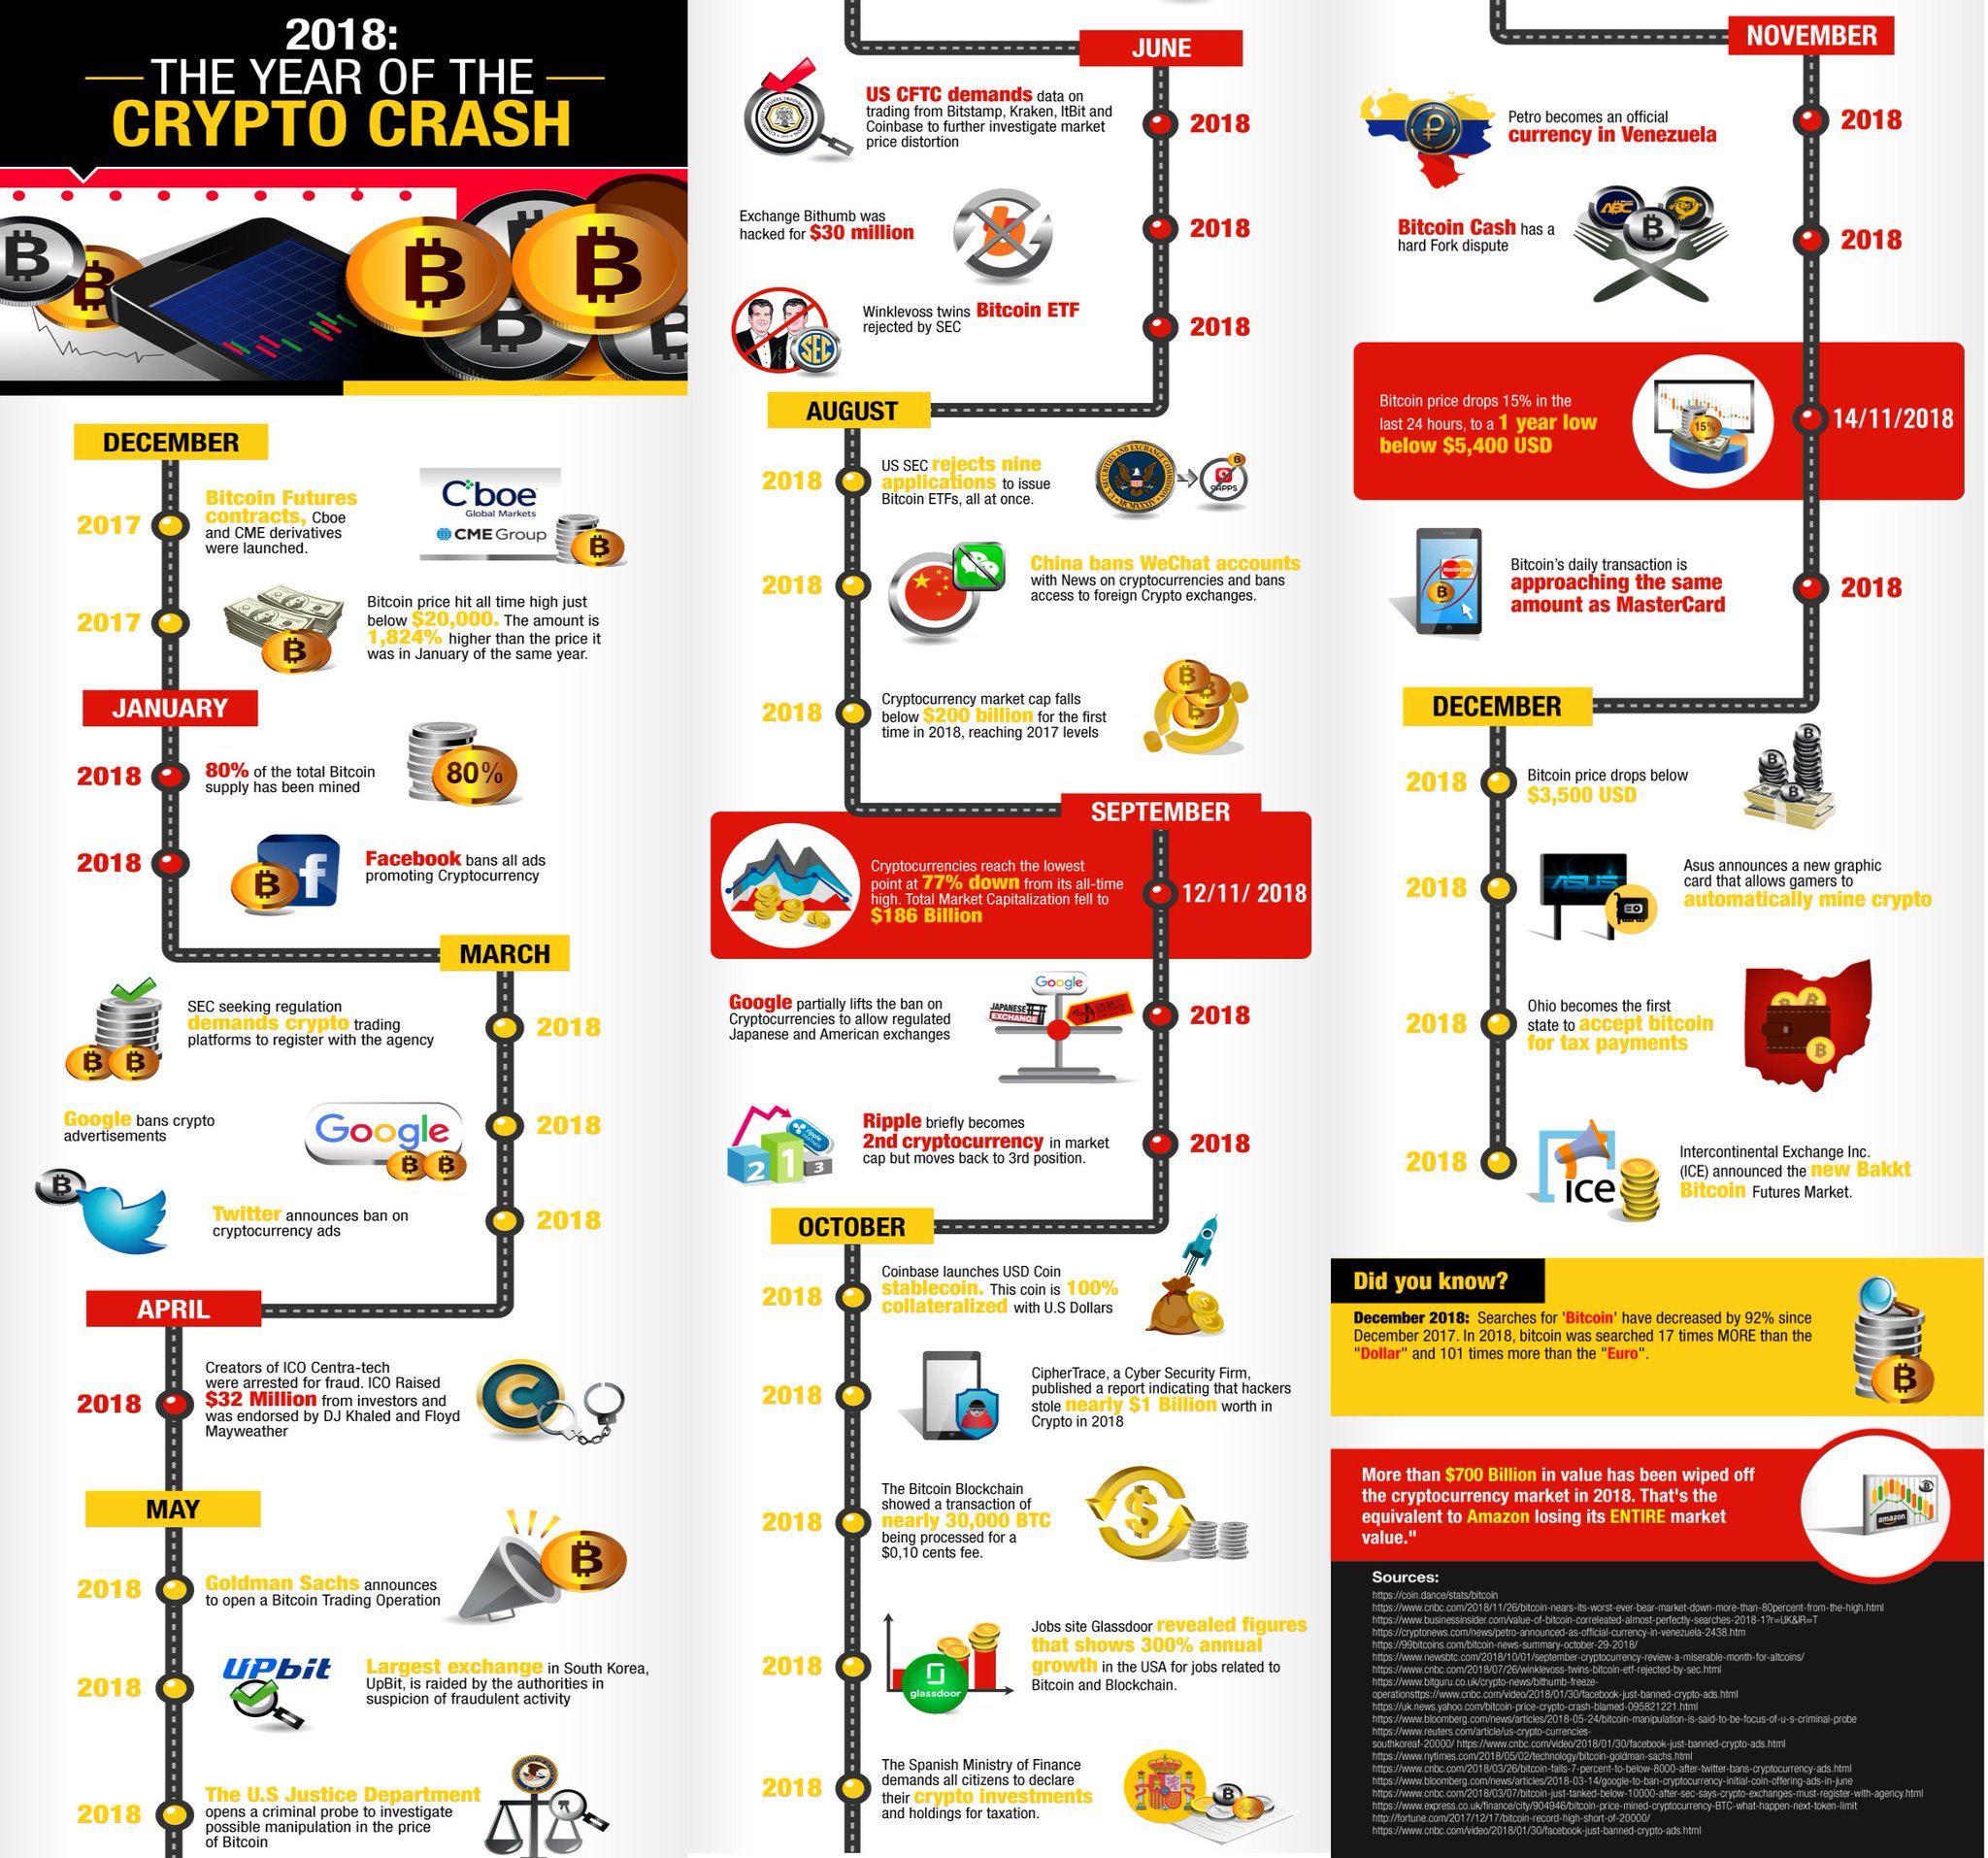
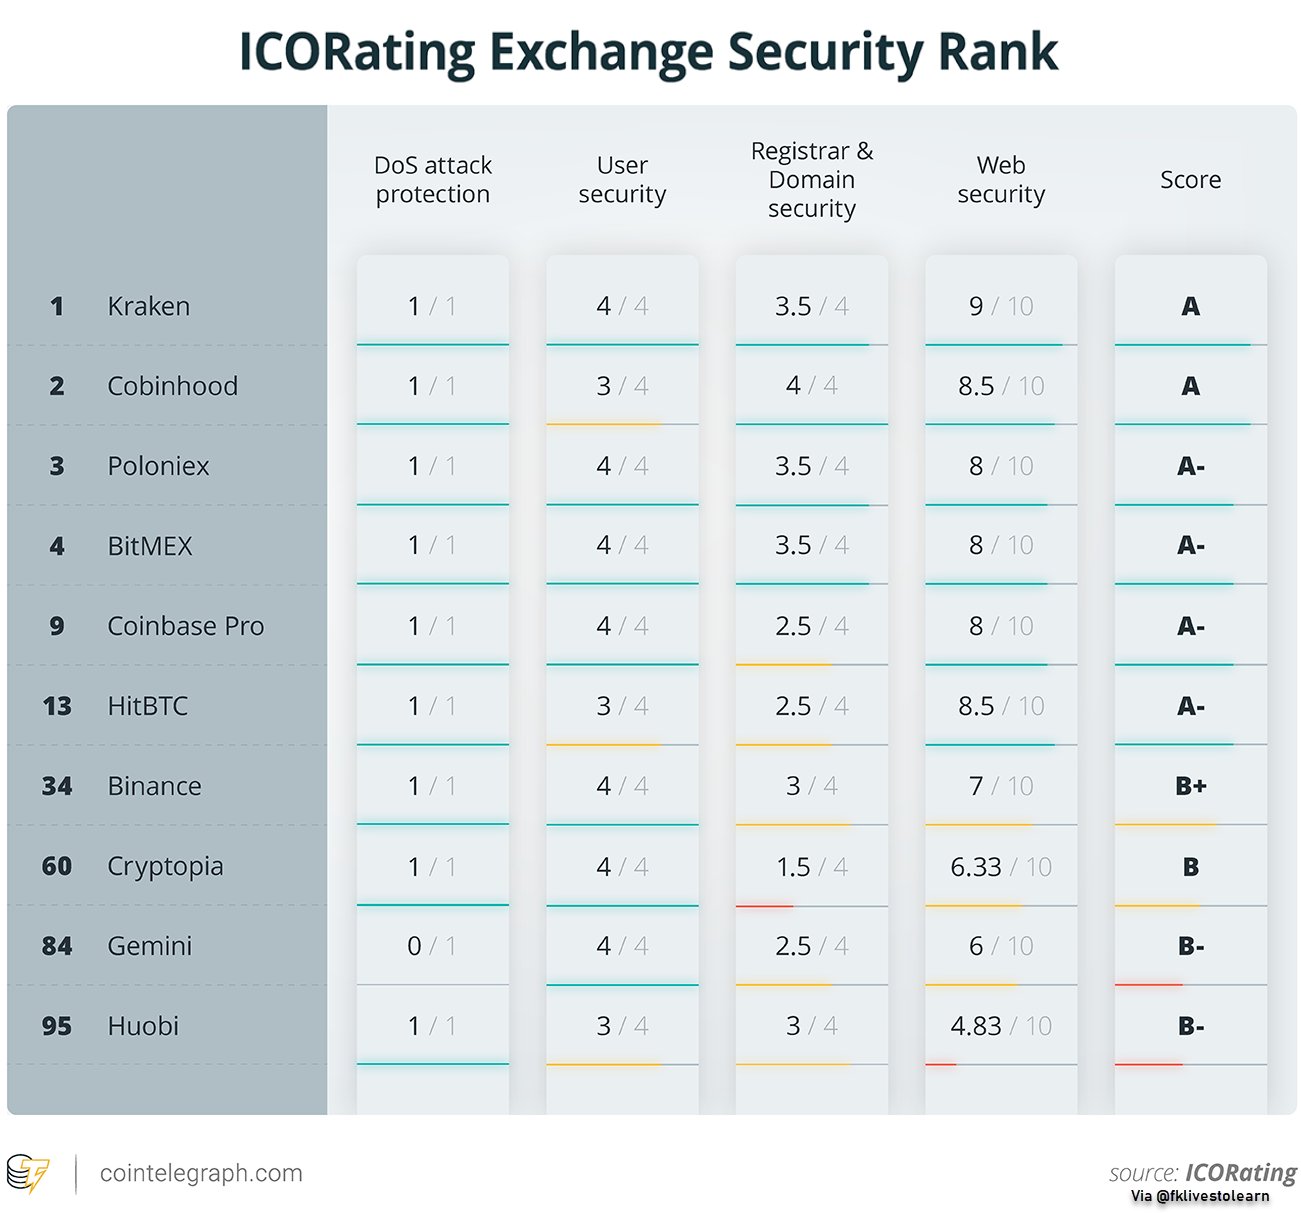
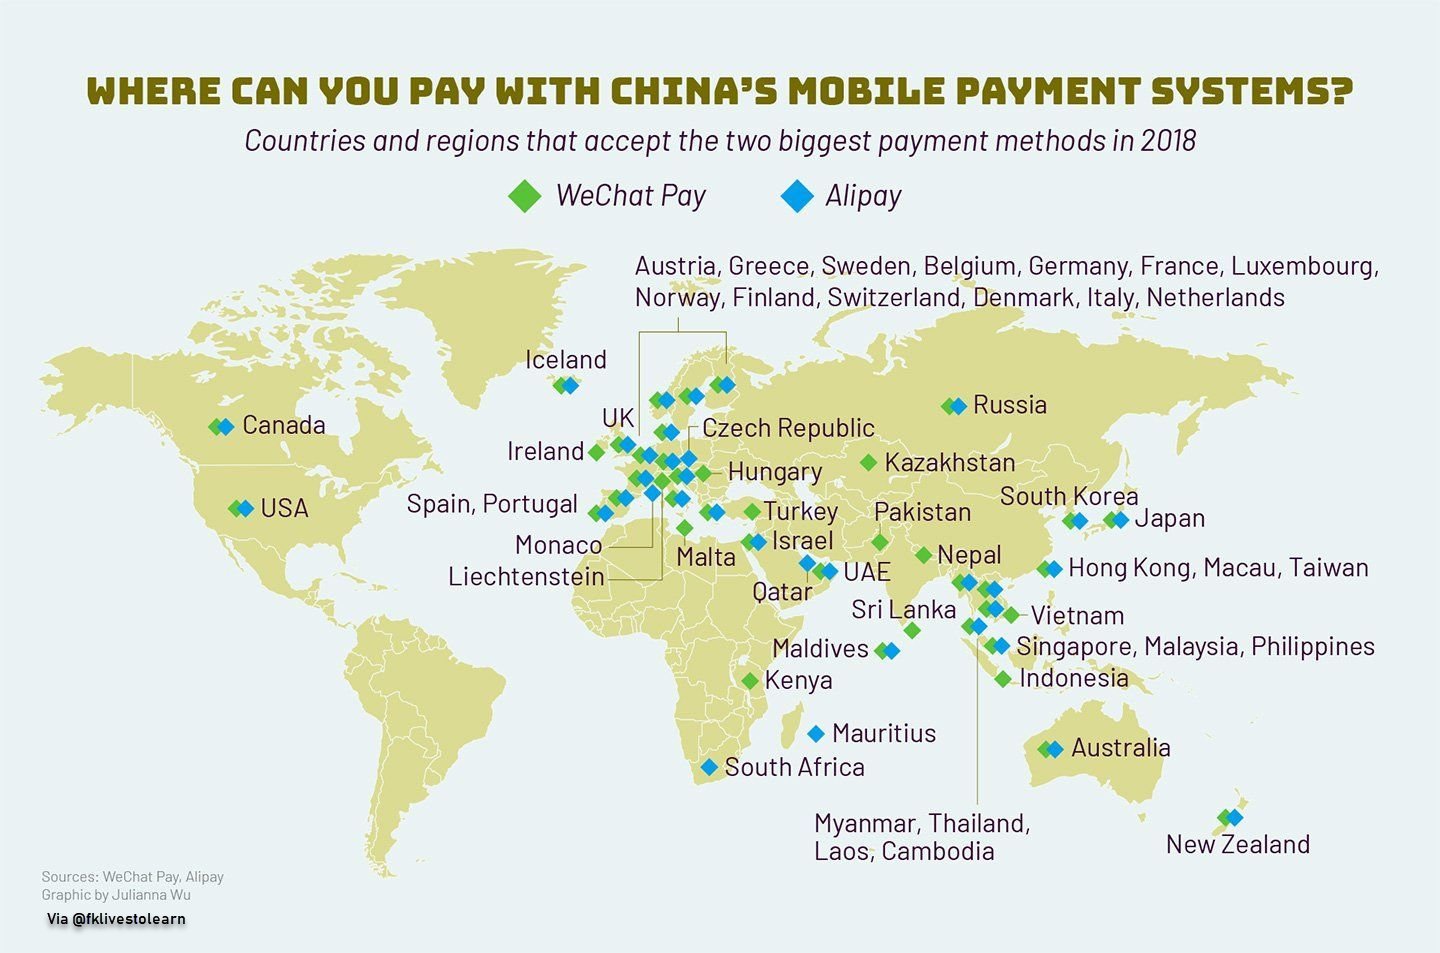
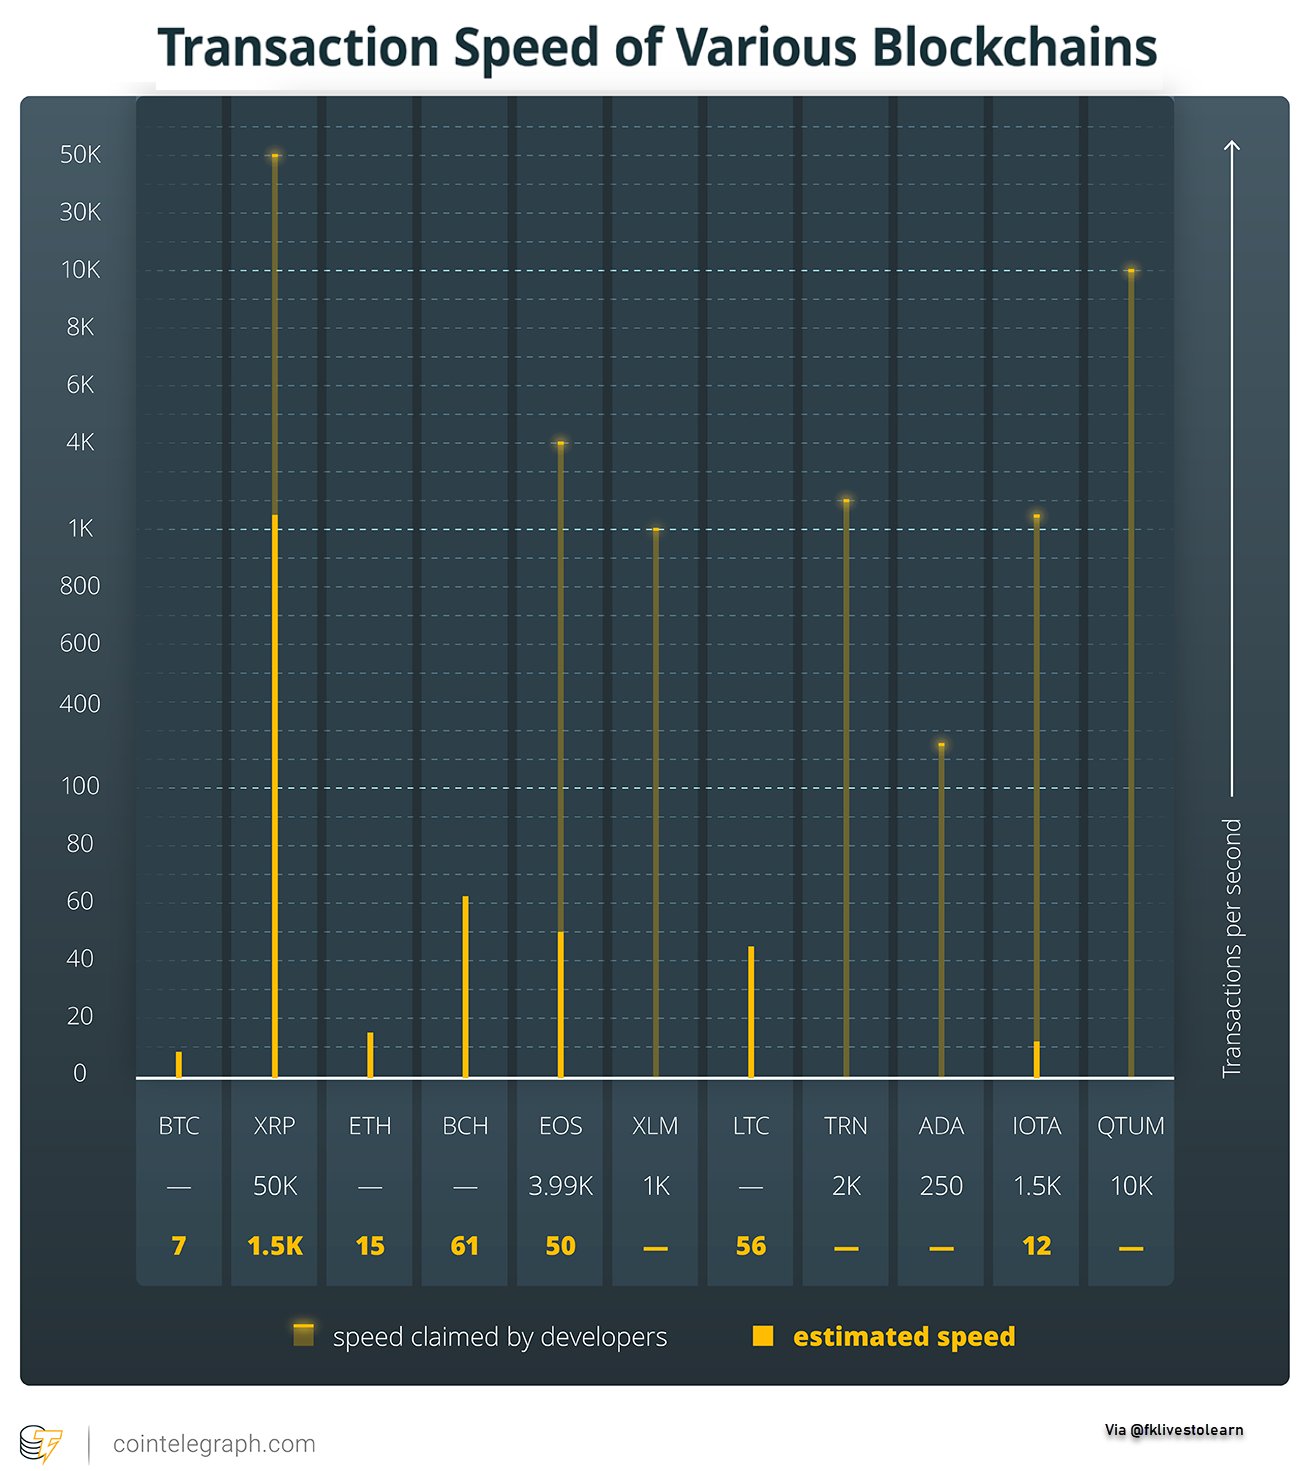
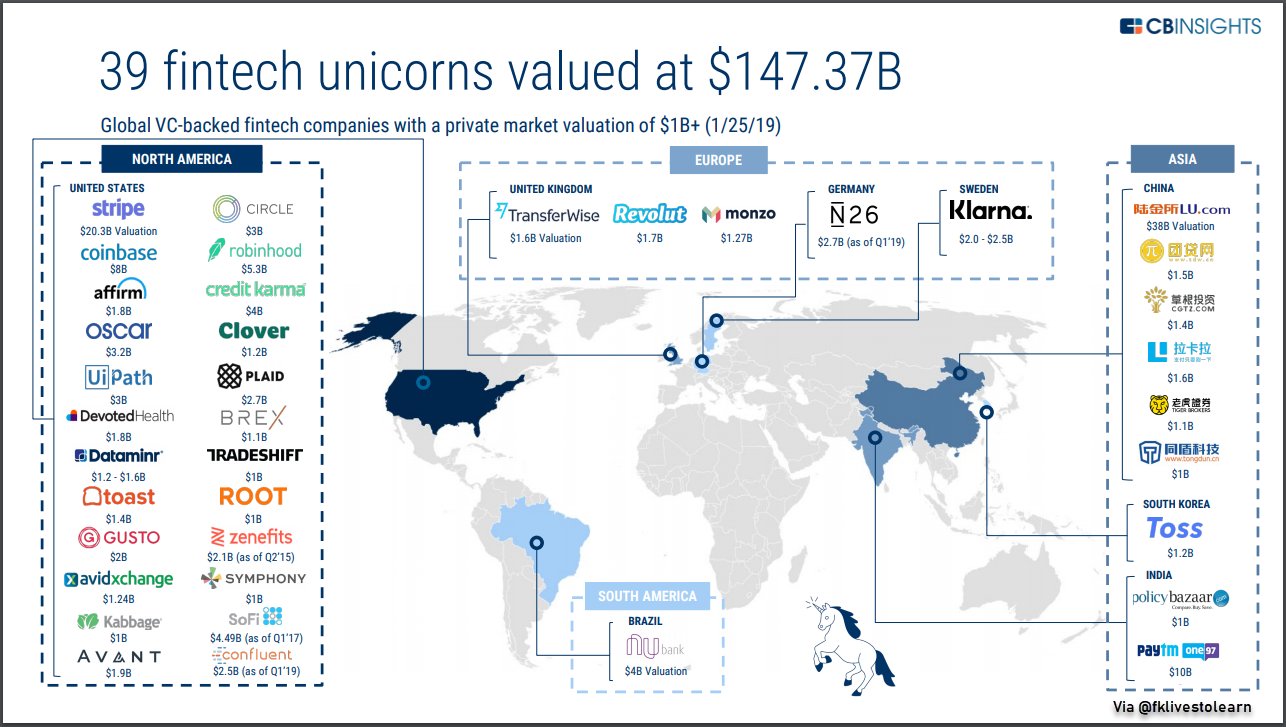
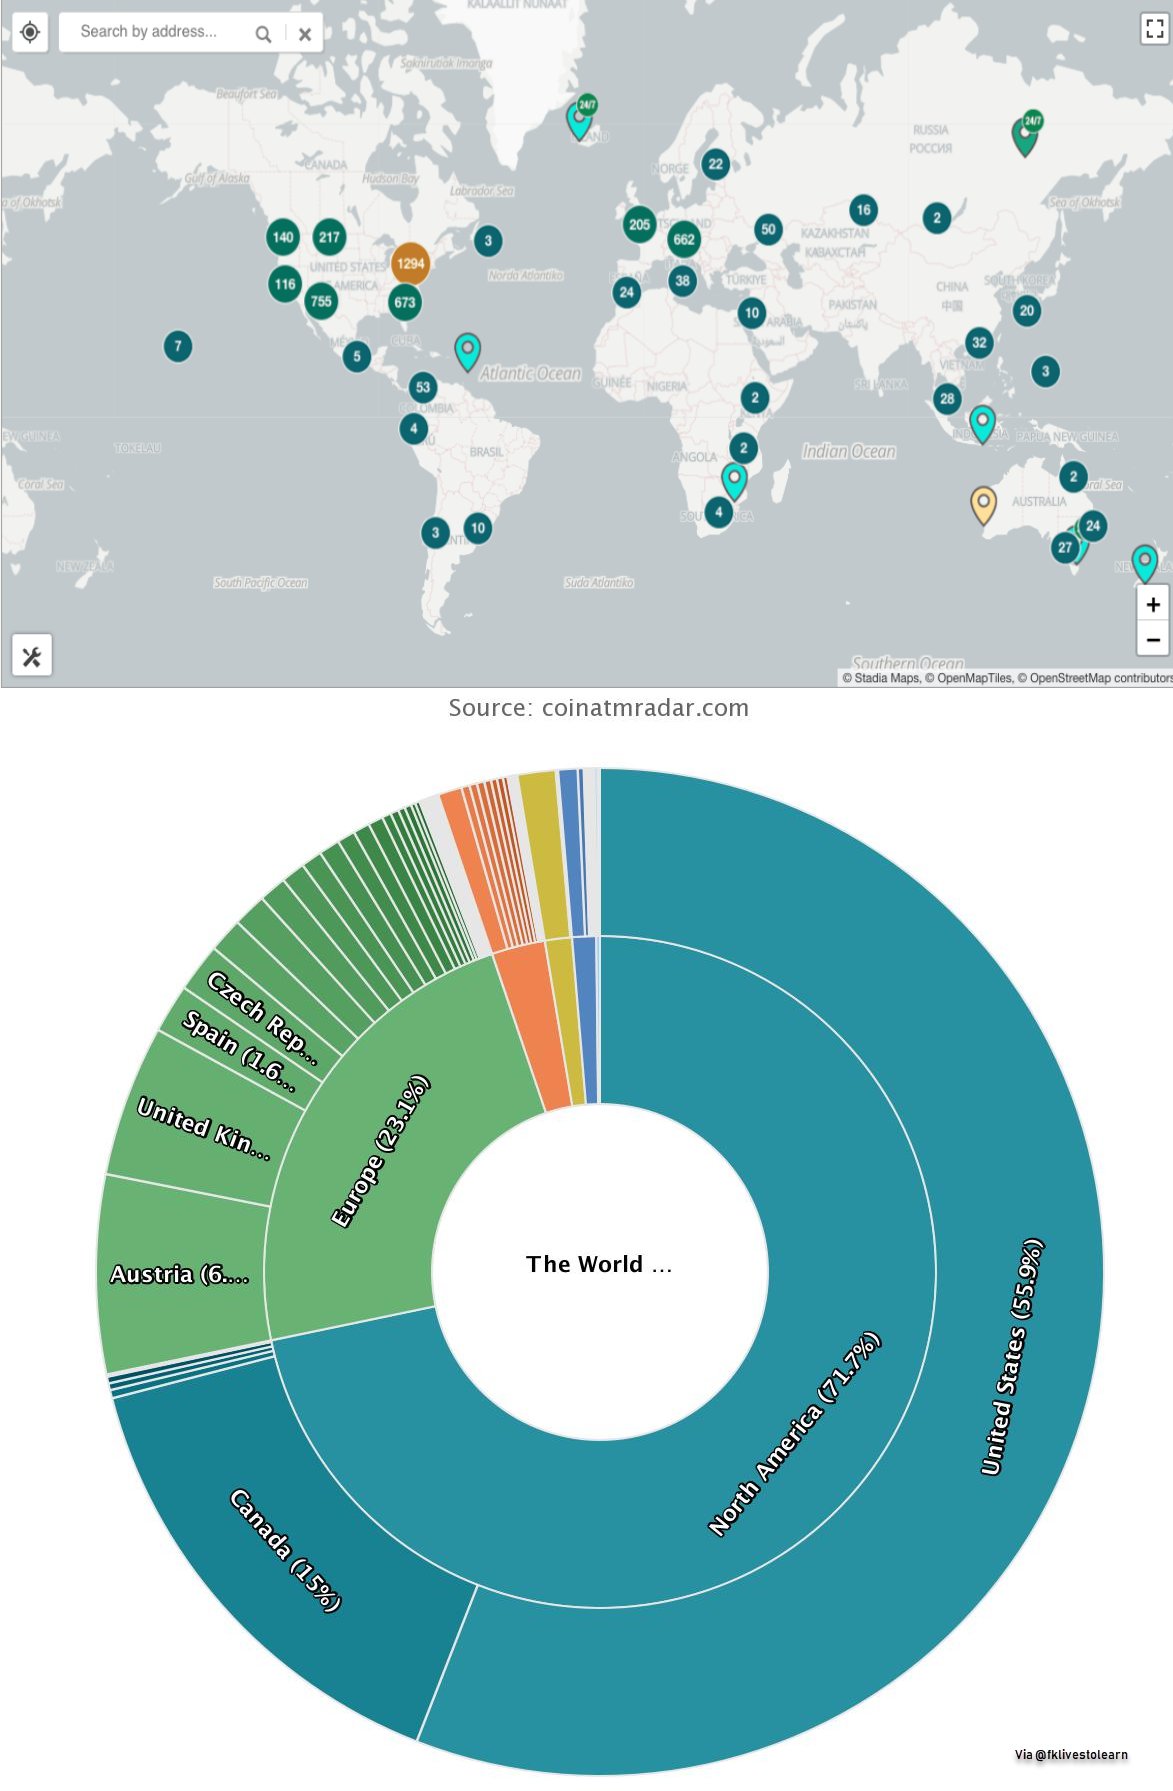
- Blockchain, Cryptocurrencies, Fintech etc.
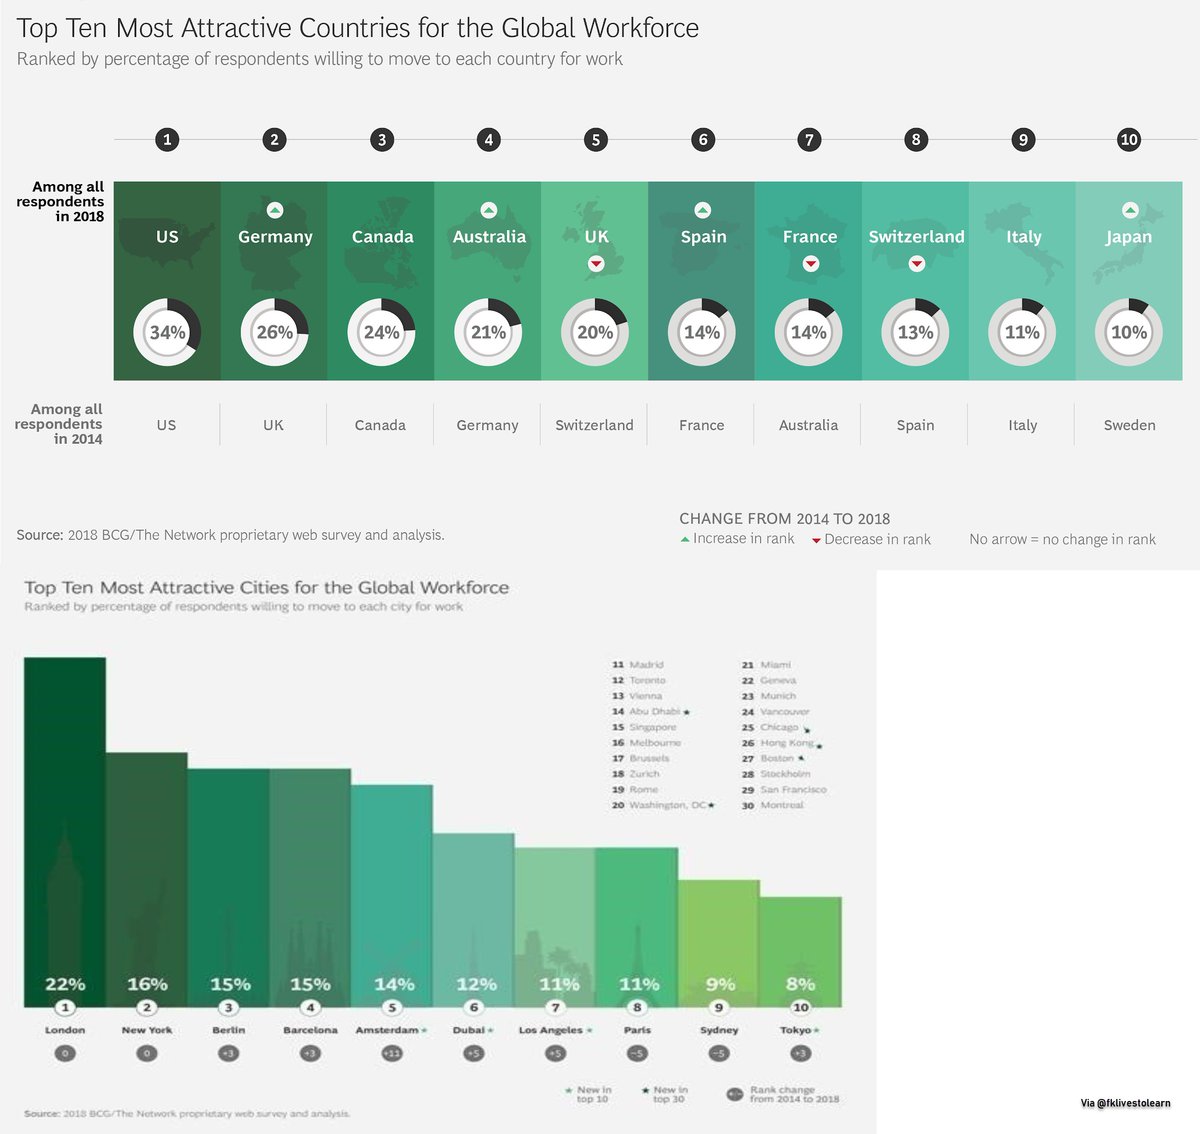
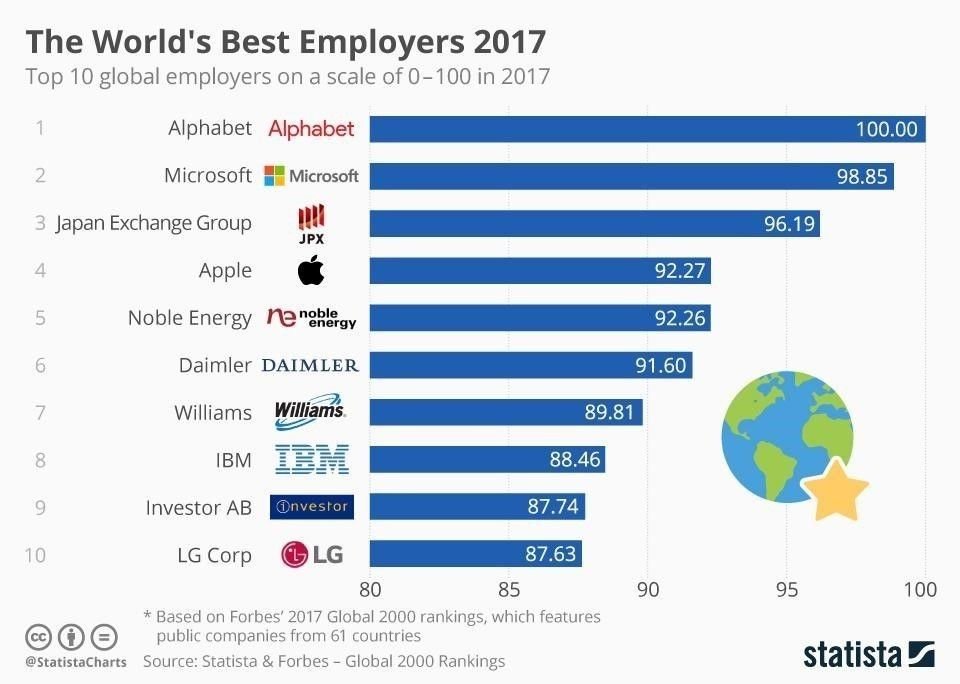
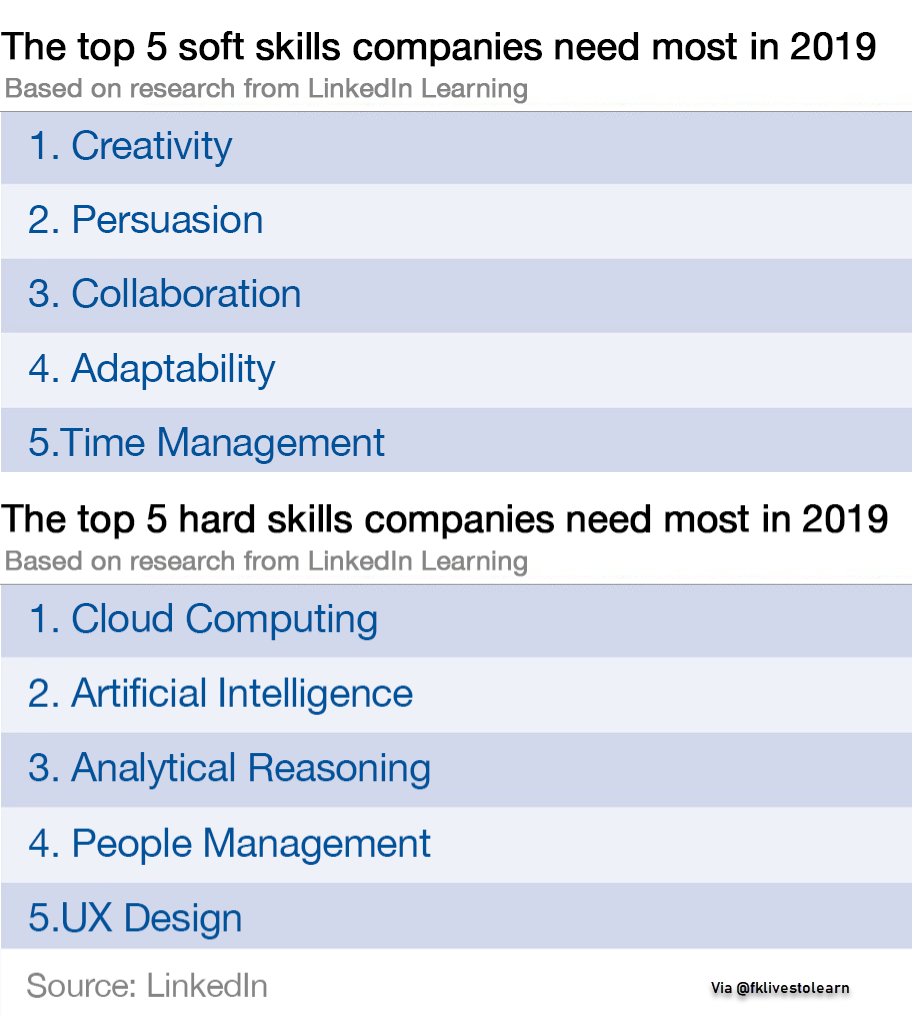
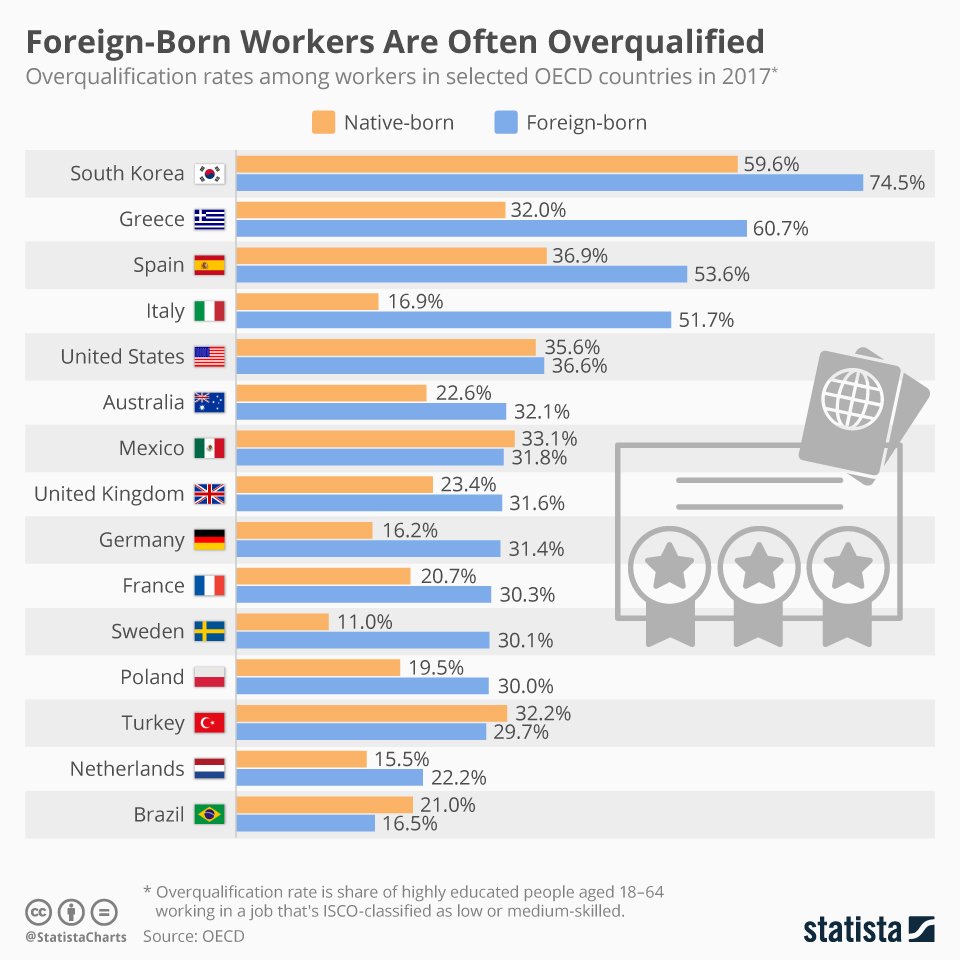
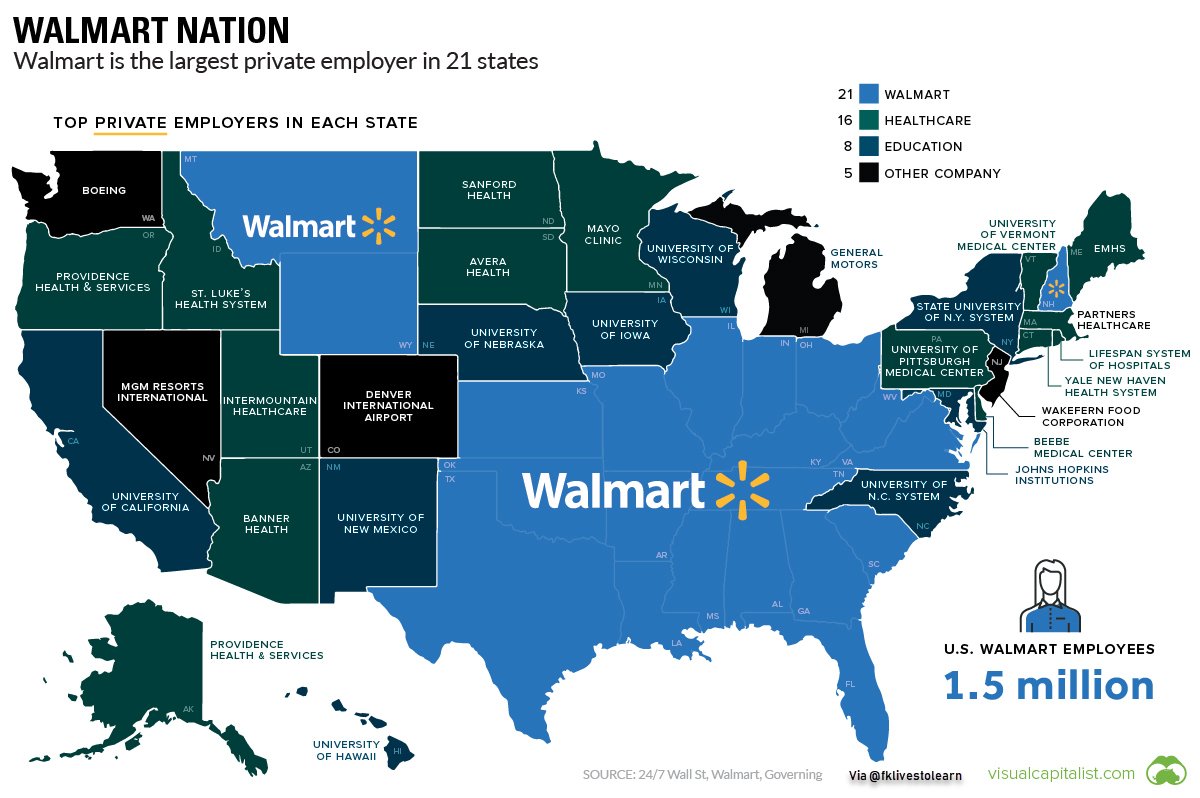
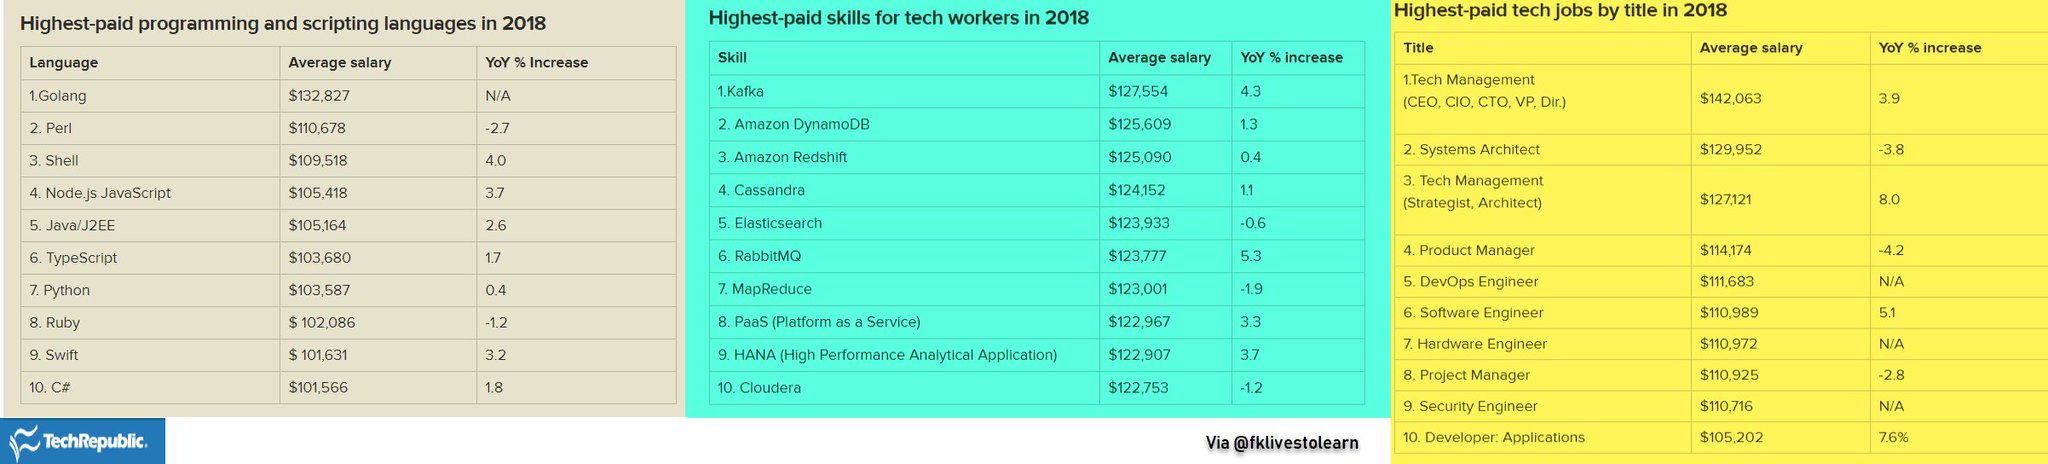
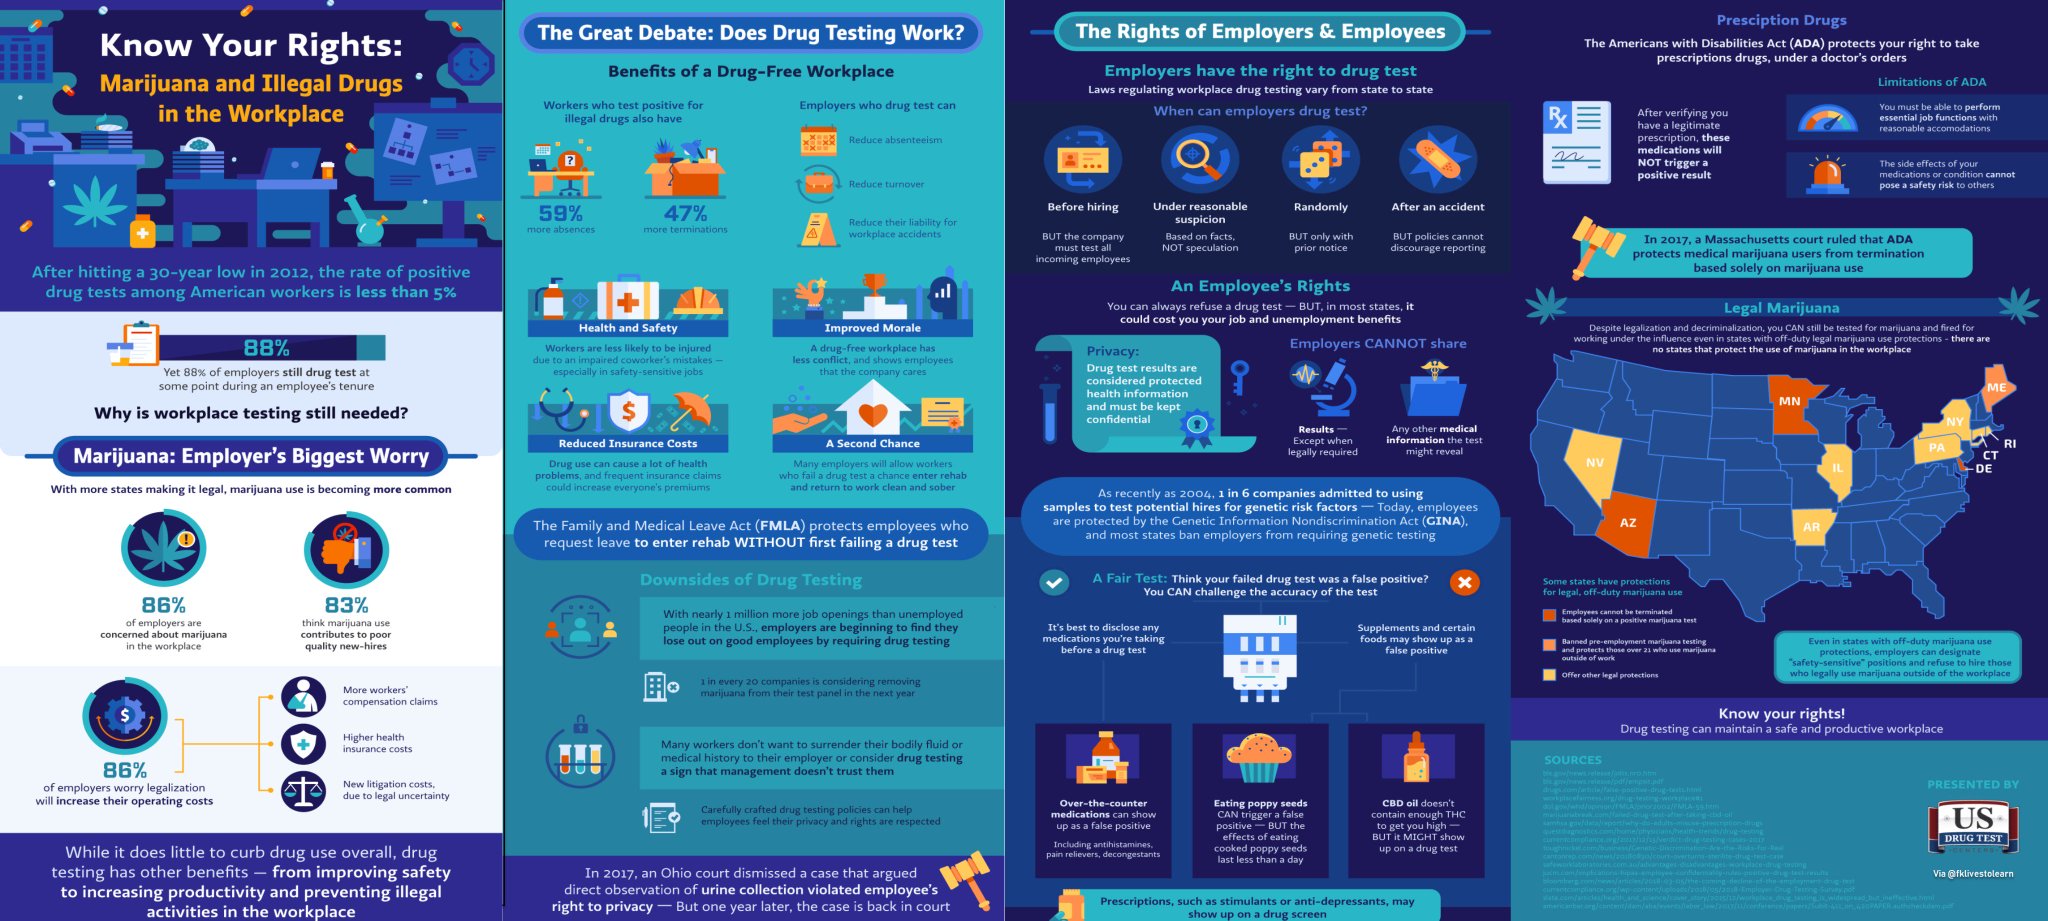
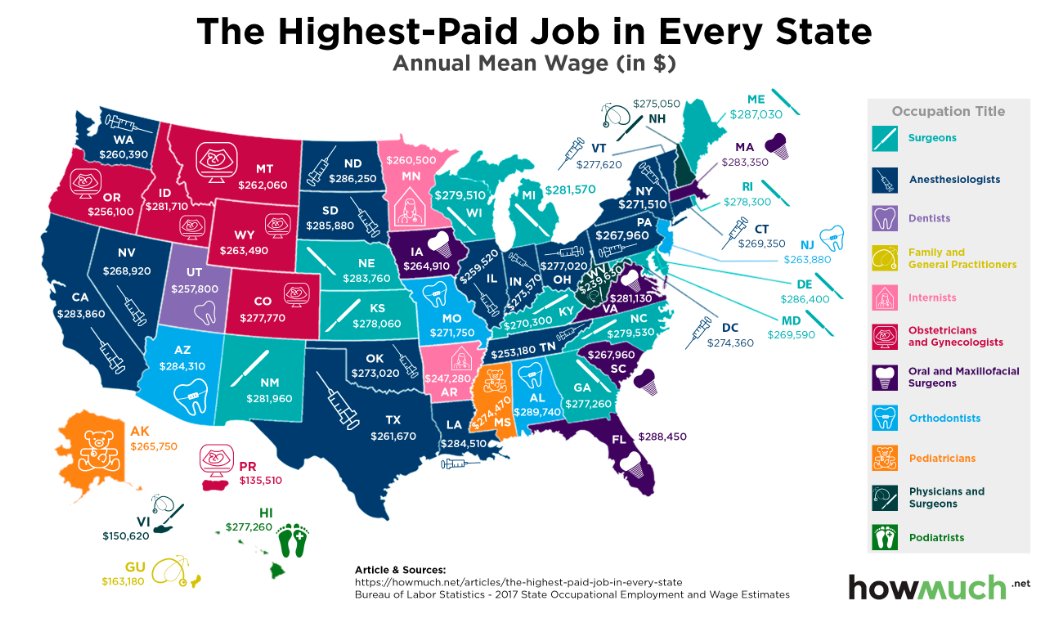
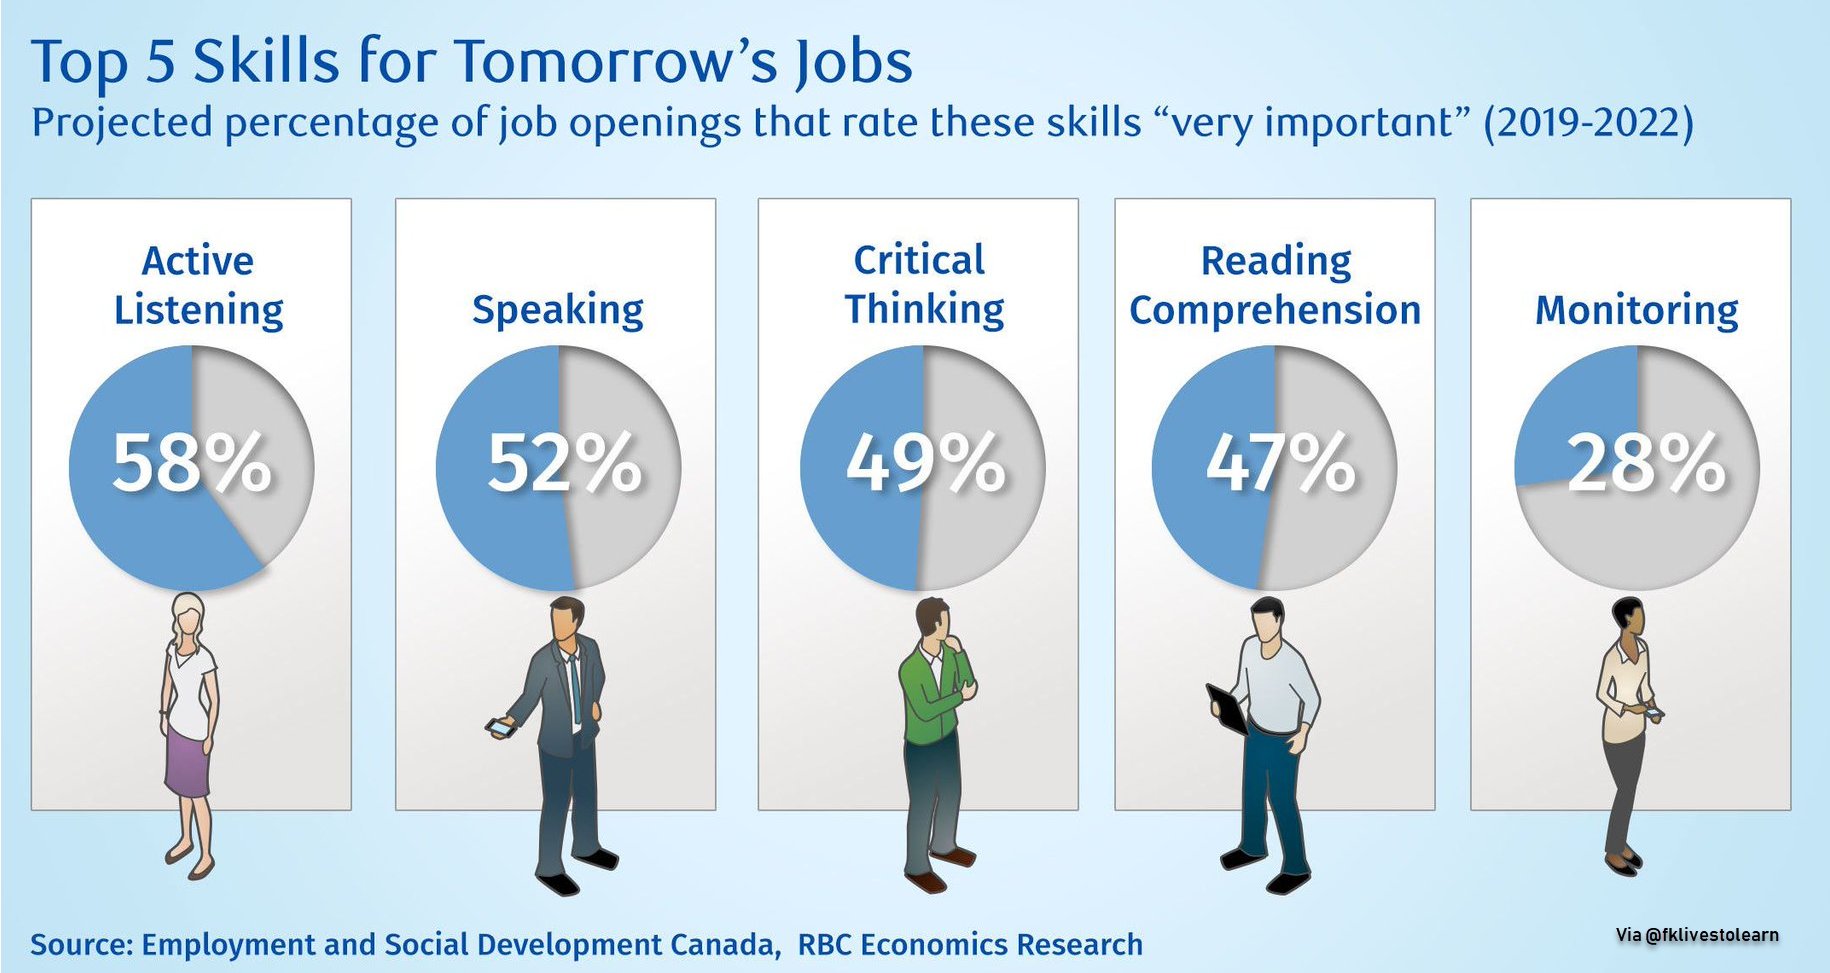
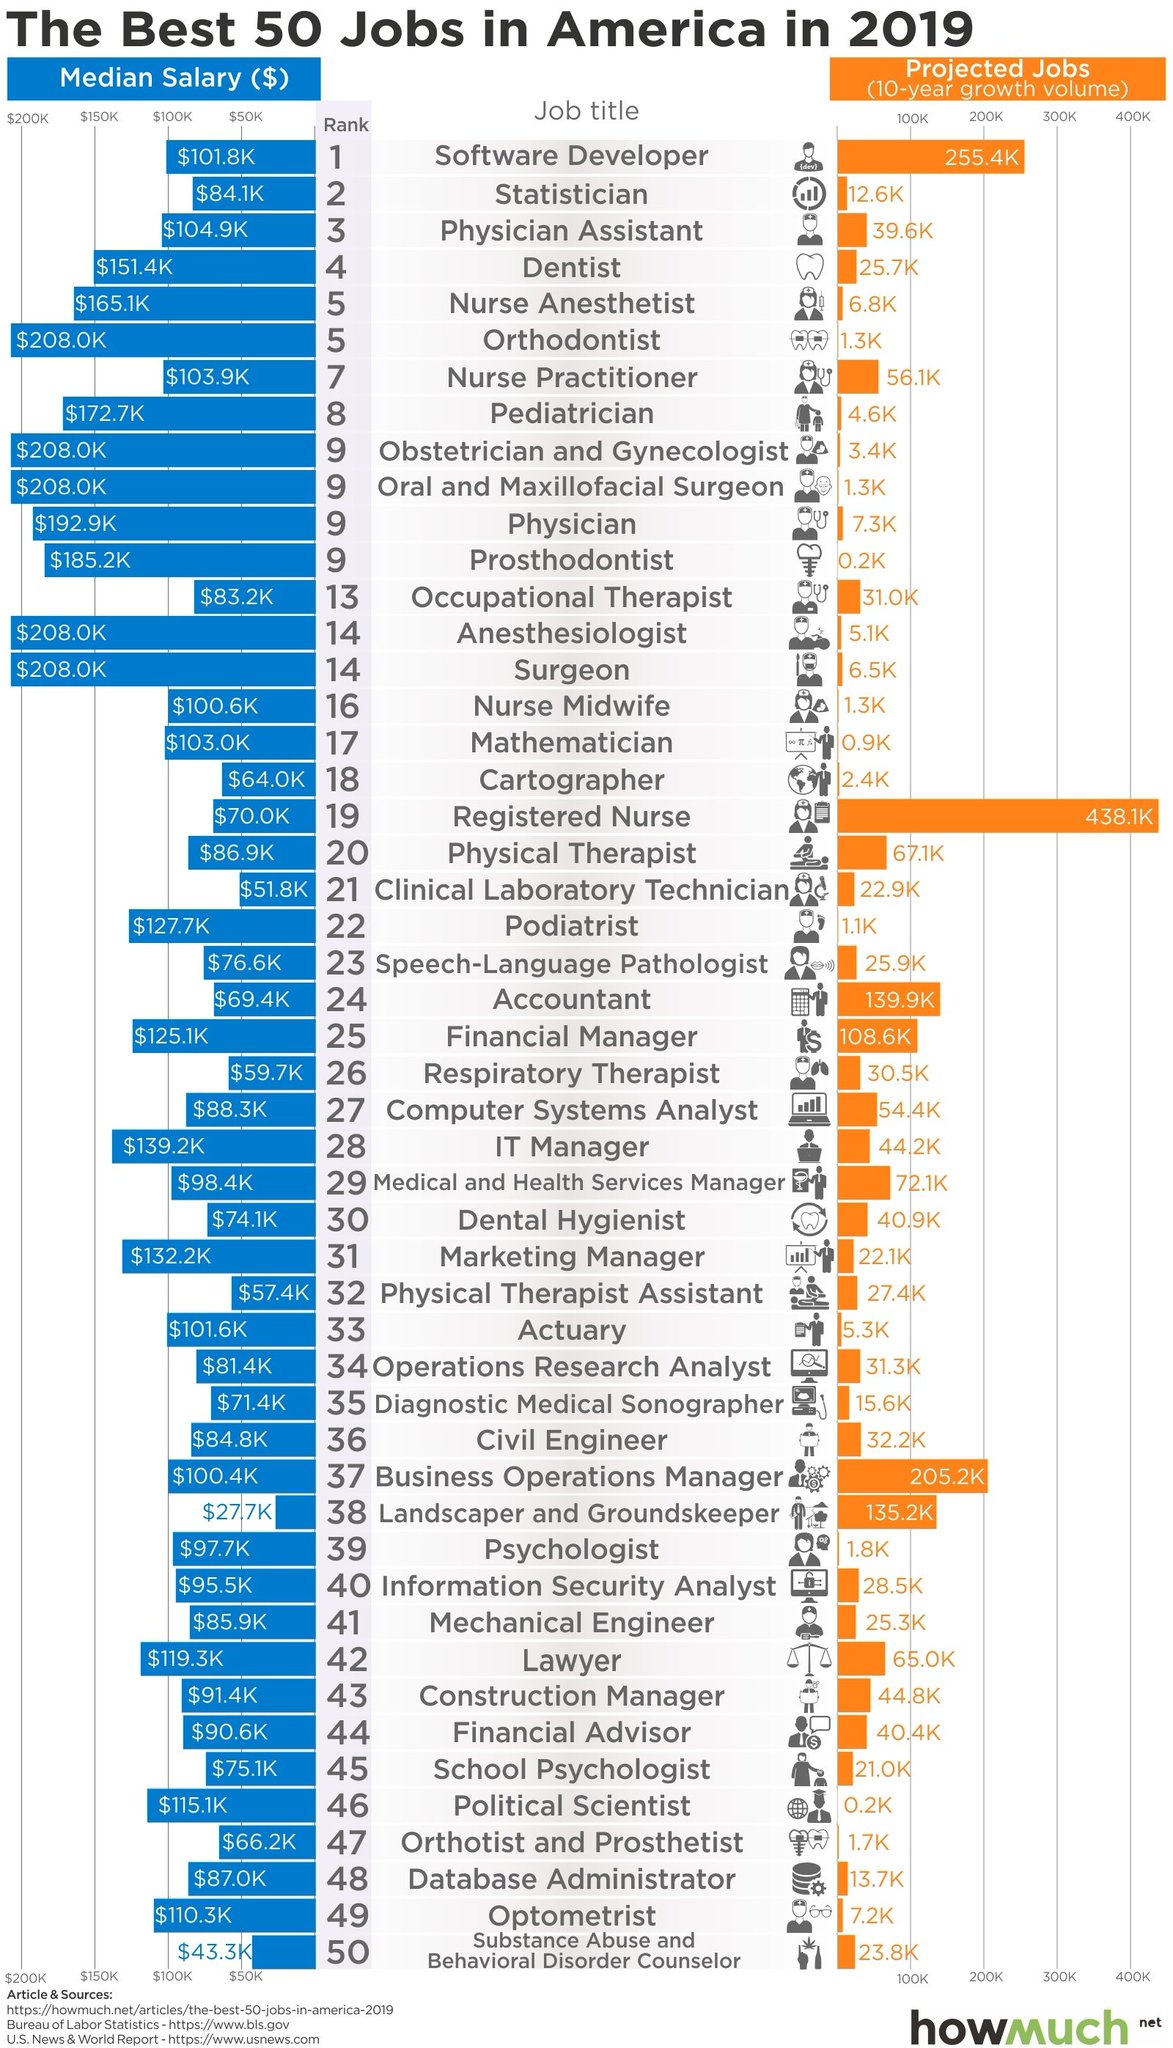
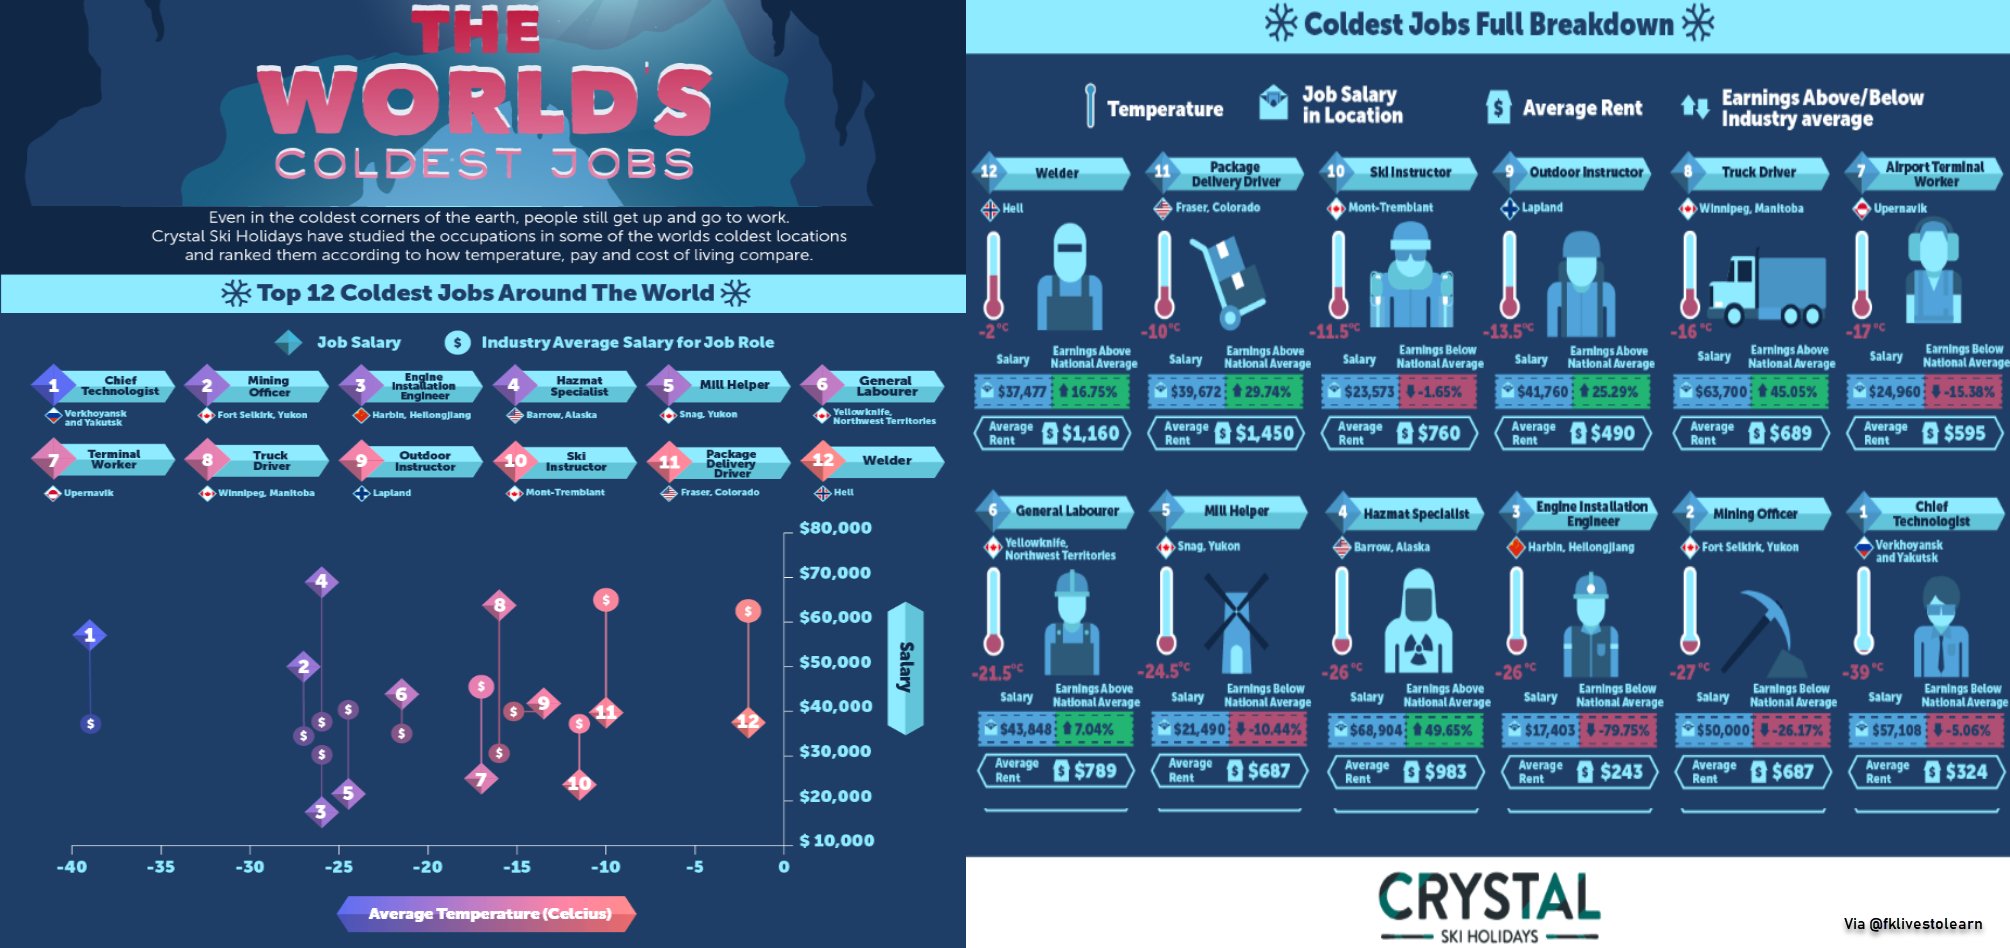
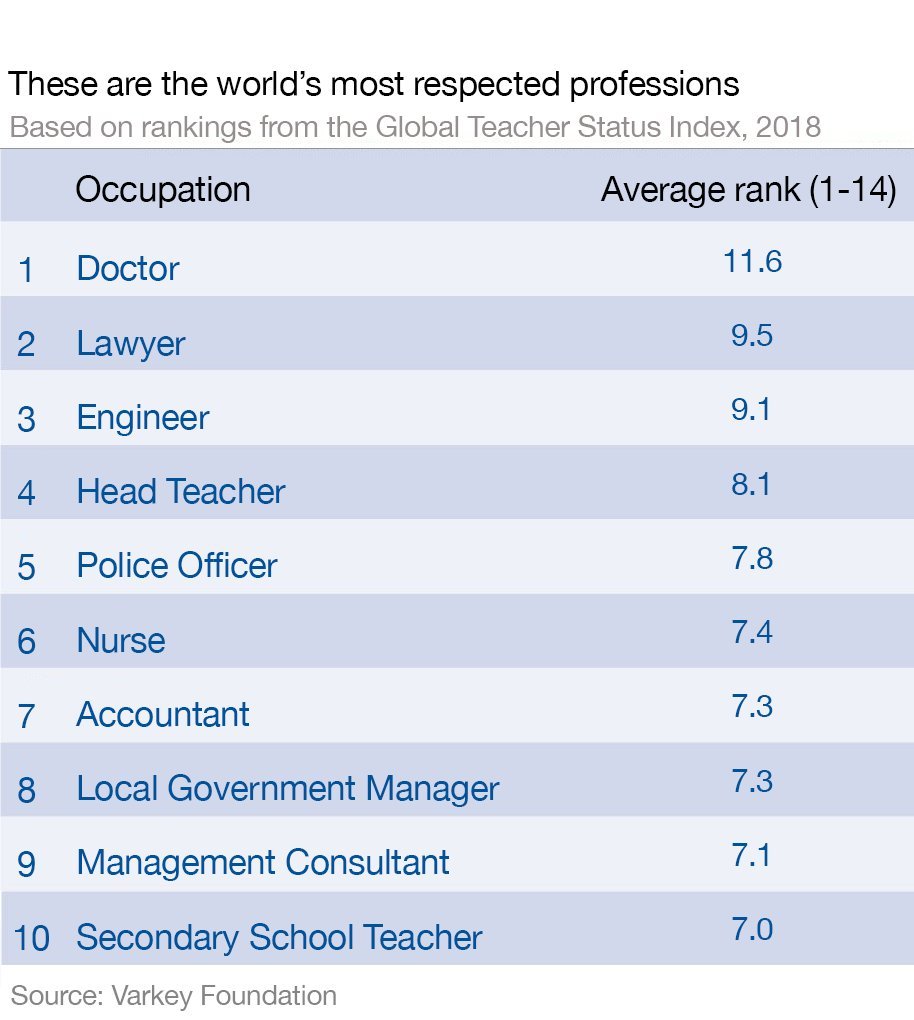
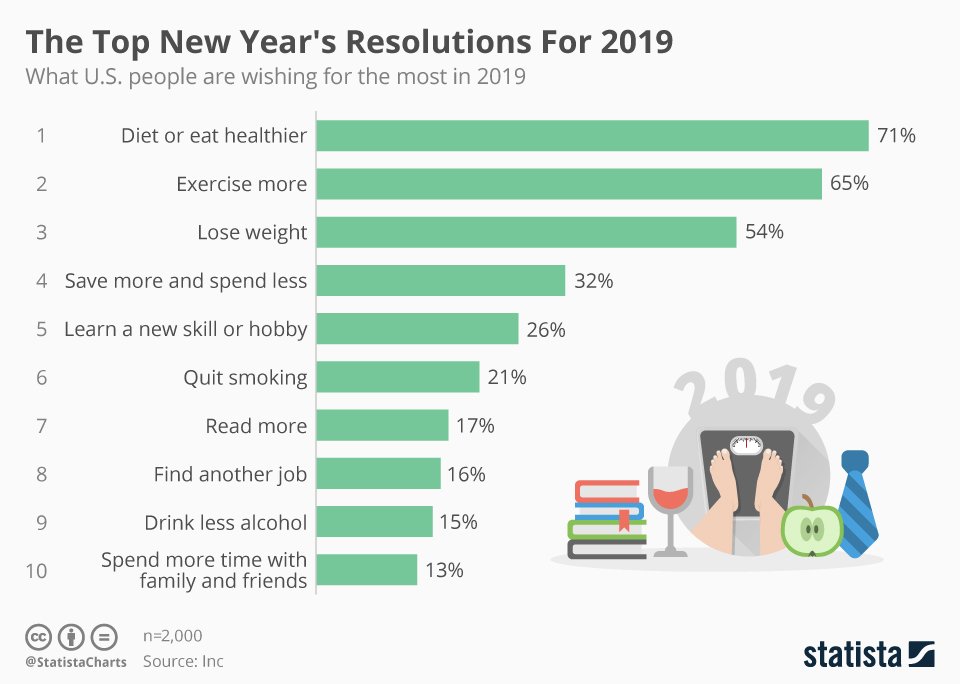
- Workplace, Jobs, Productivity etc.
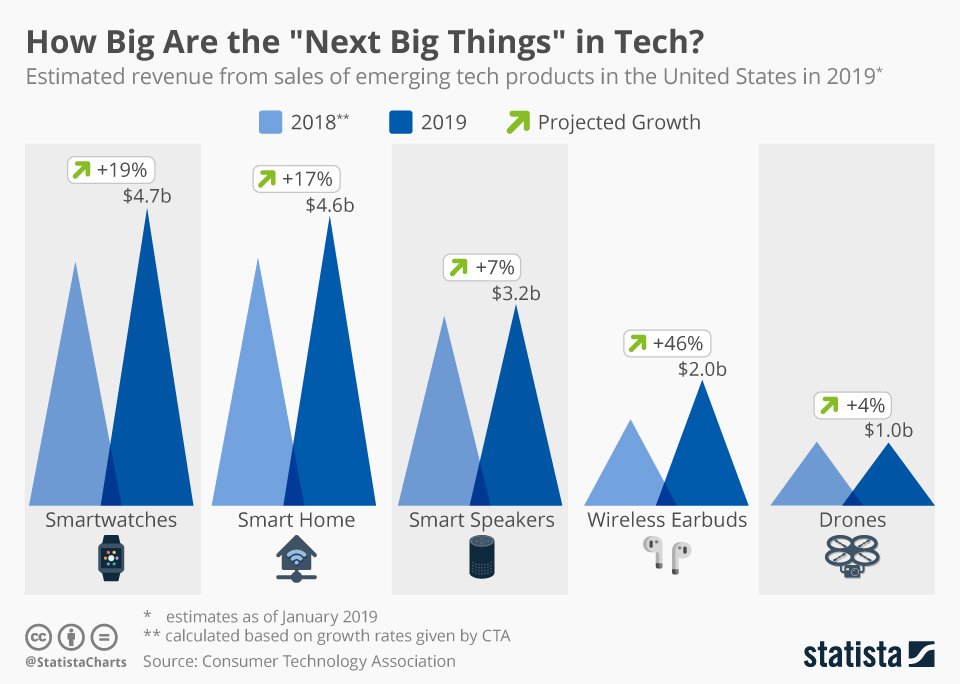
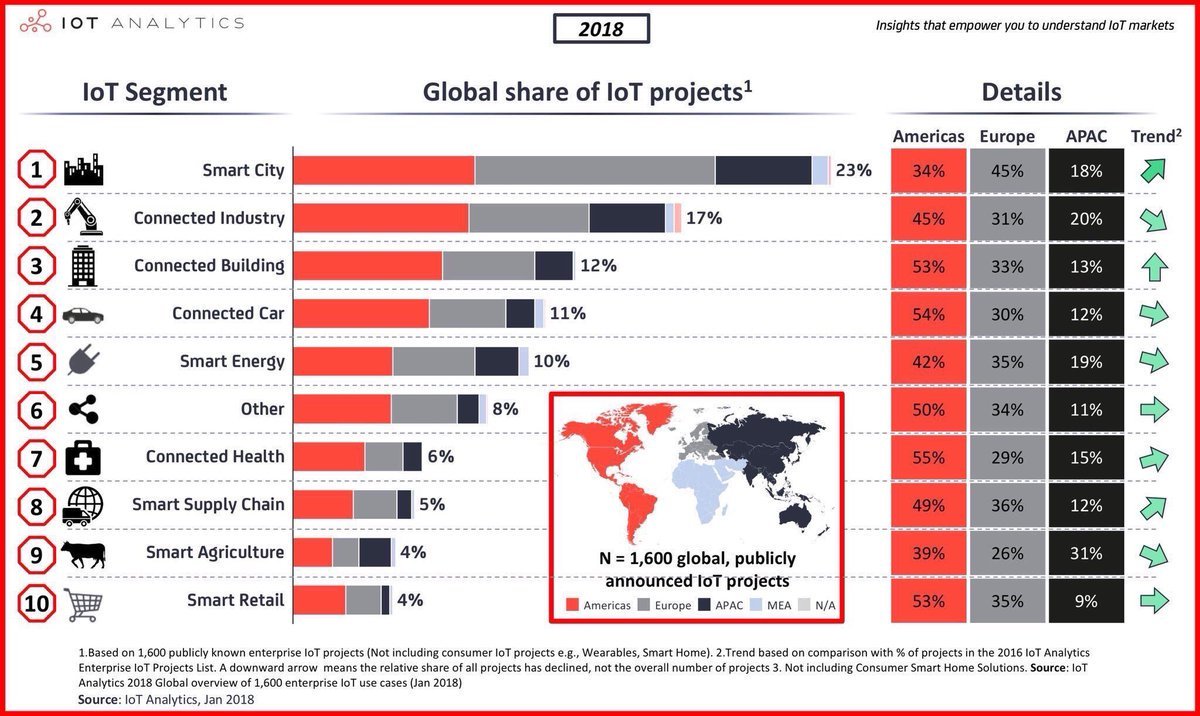
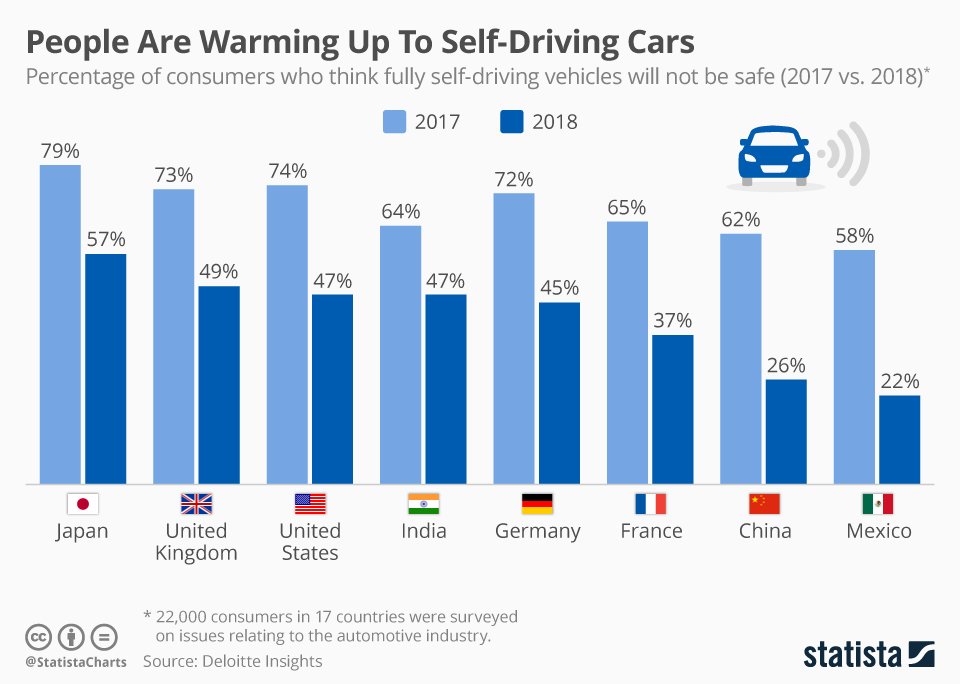
- Big Data, Machine Learning, AI, HealthTech etc.
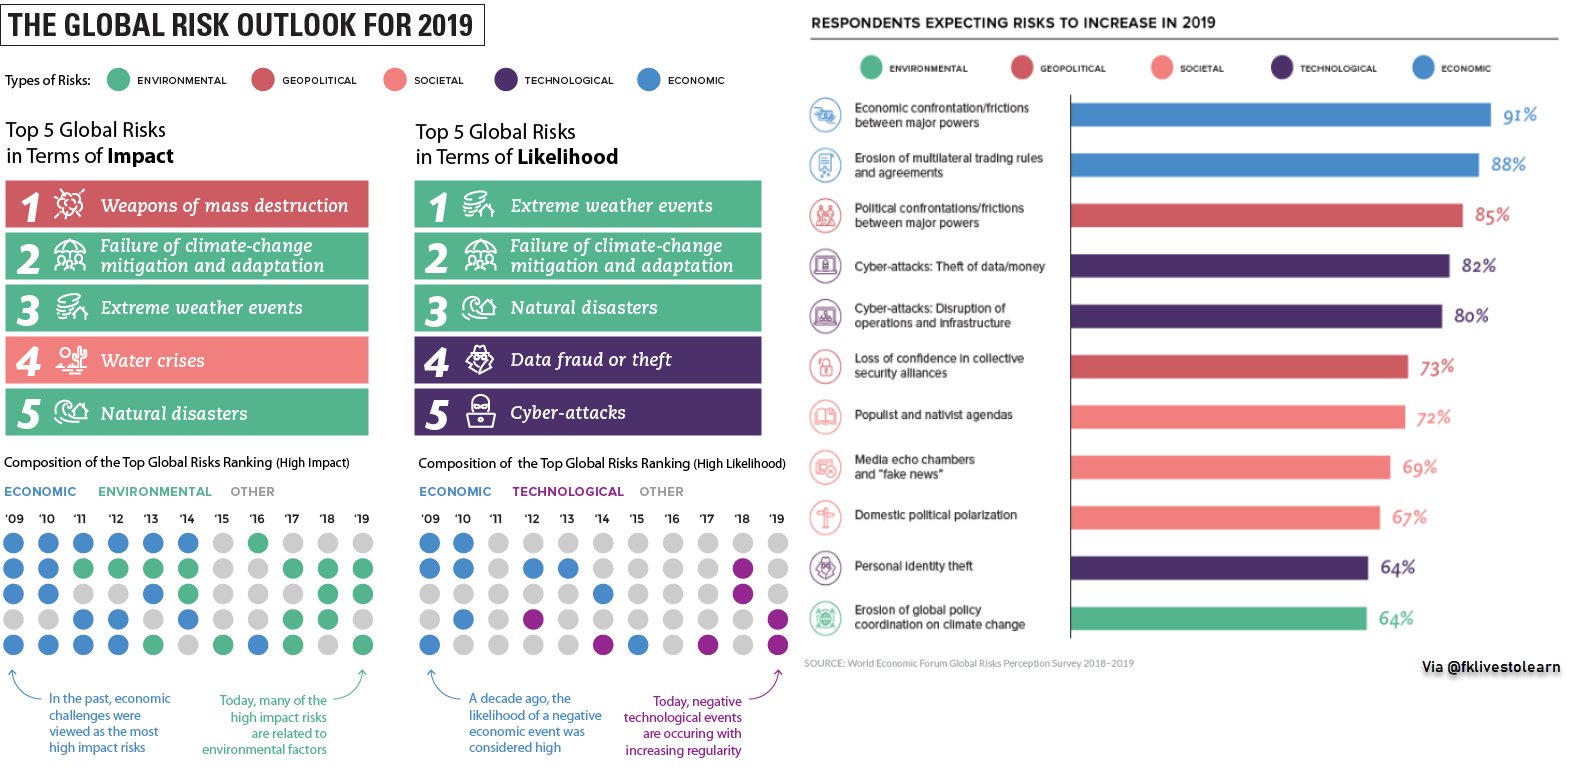
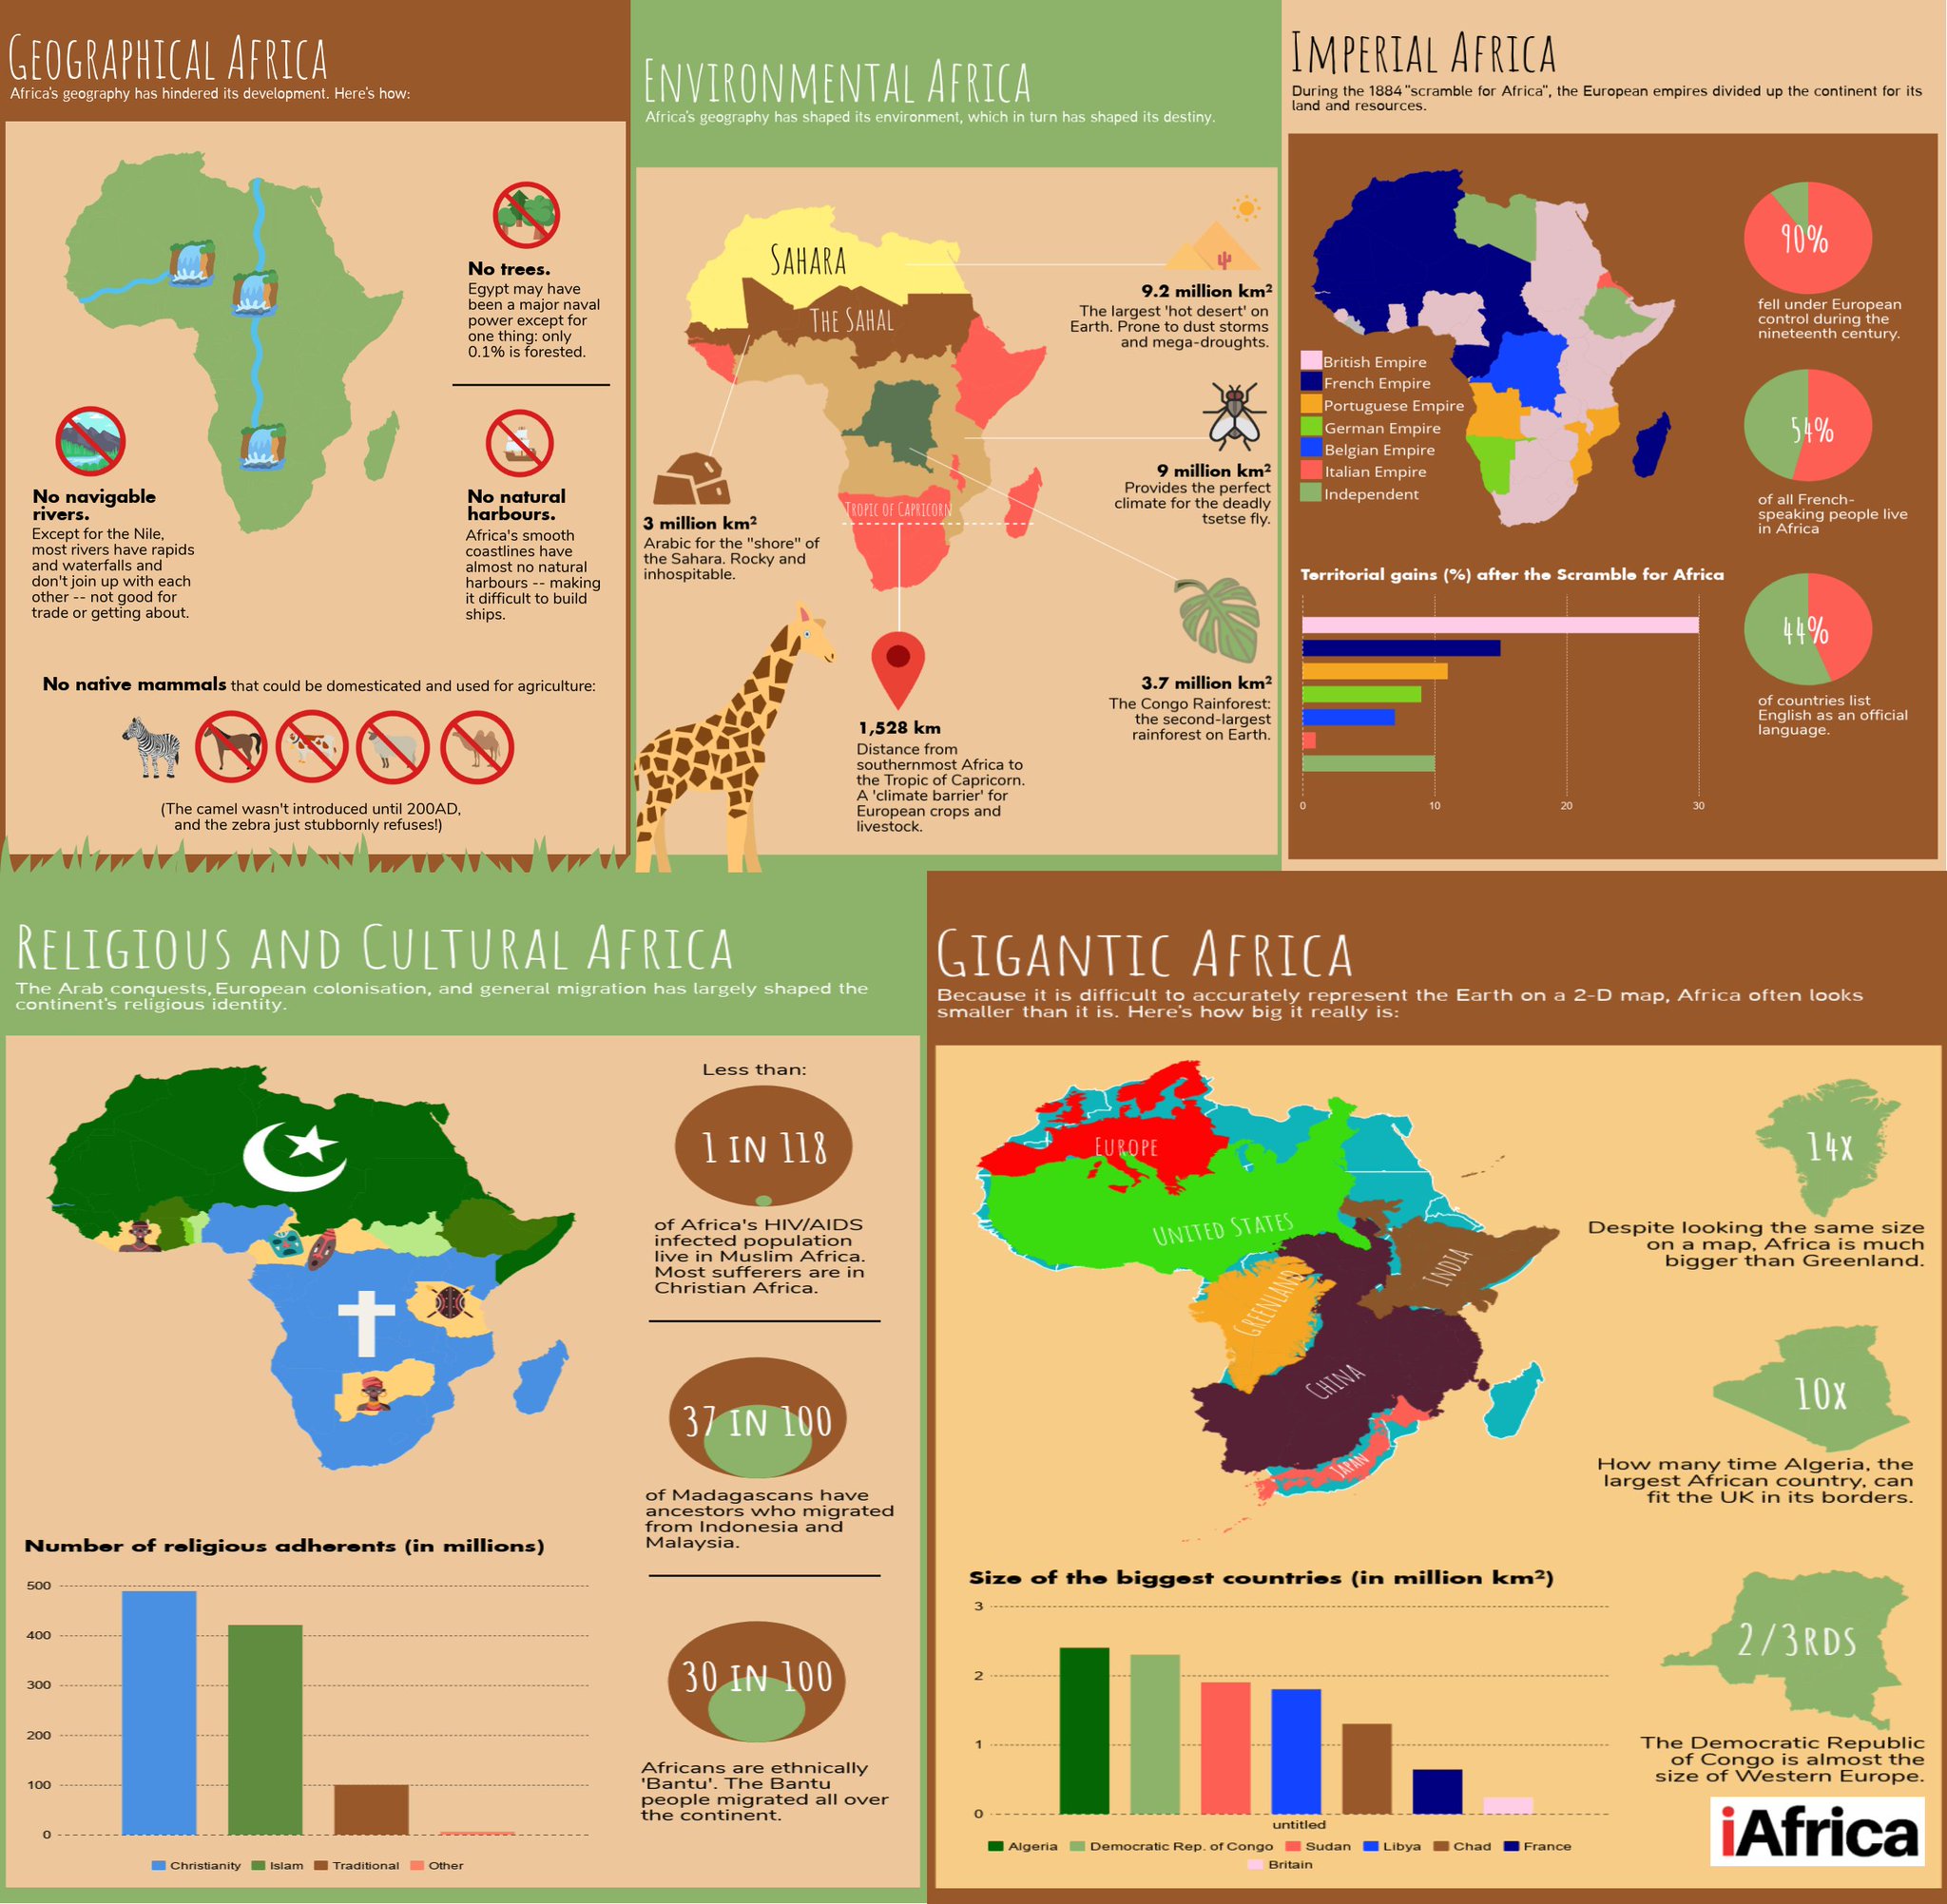
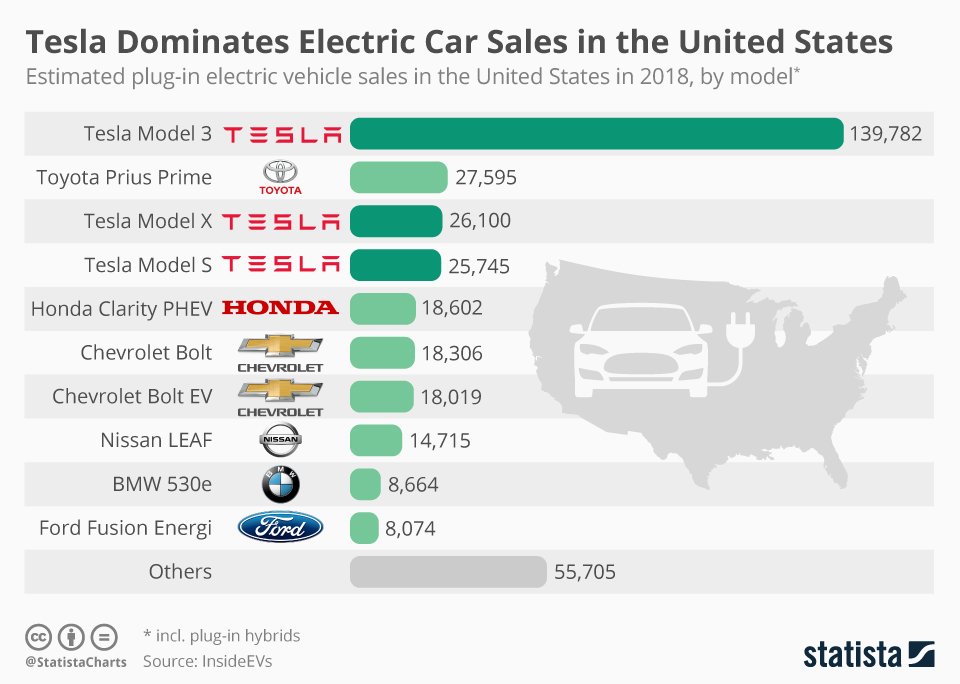
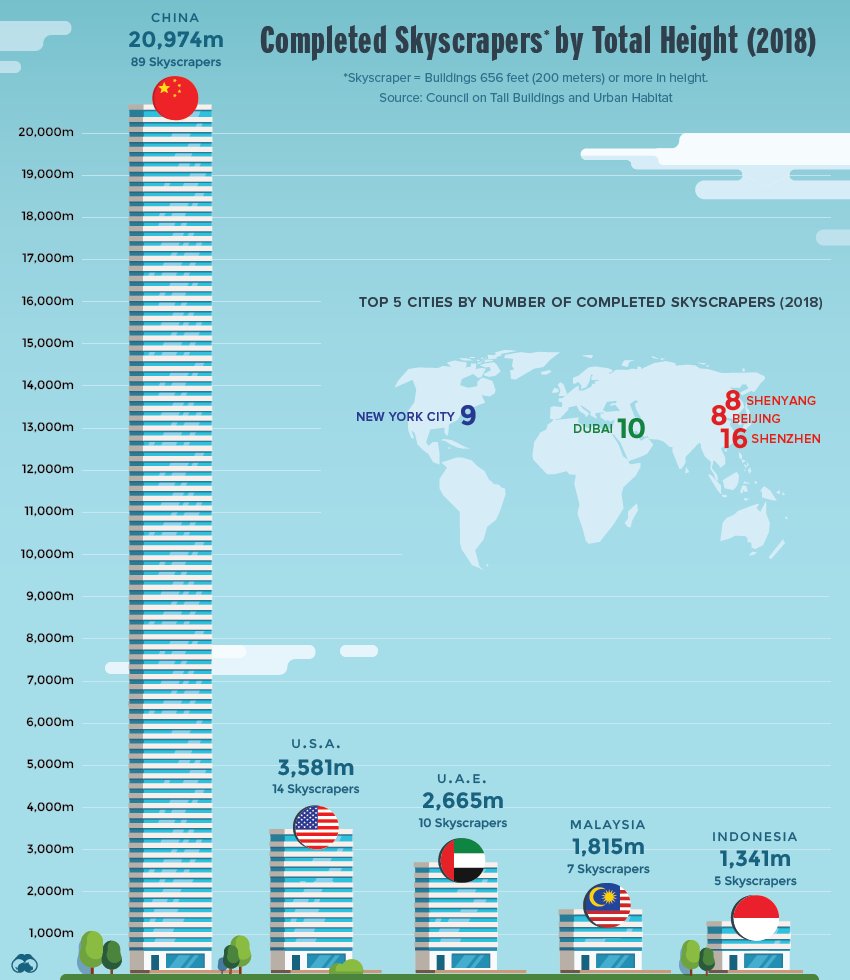
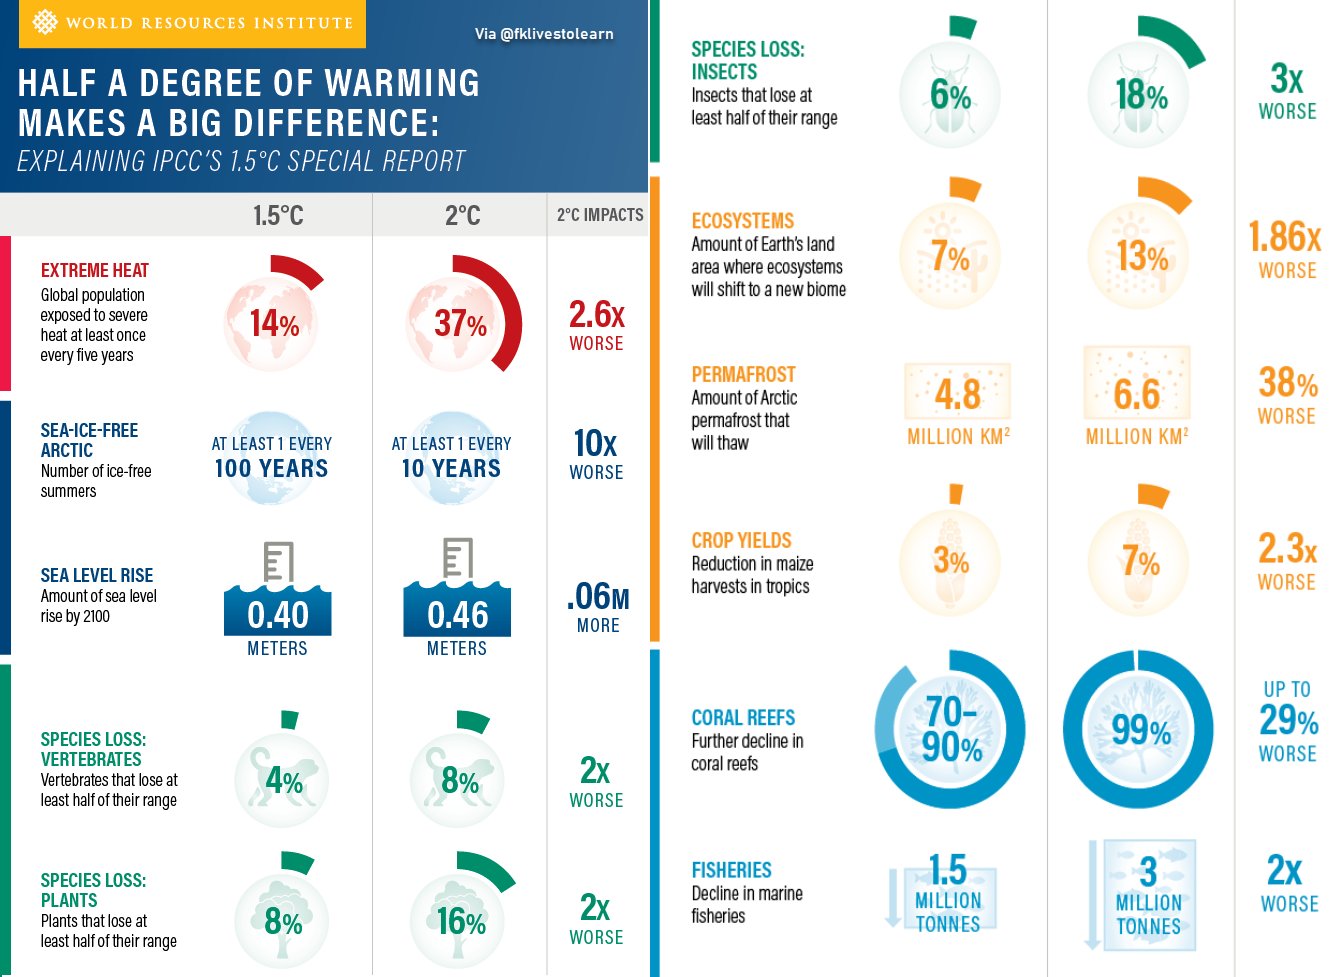
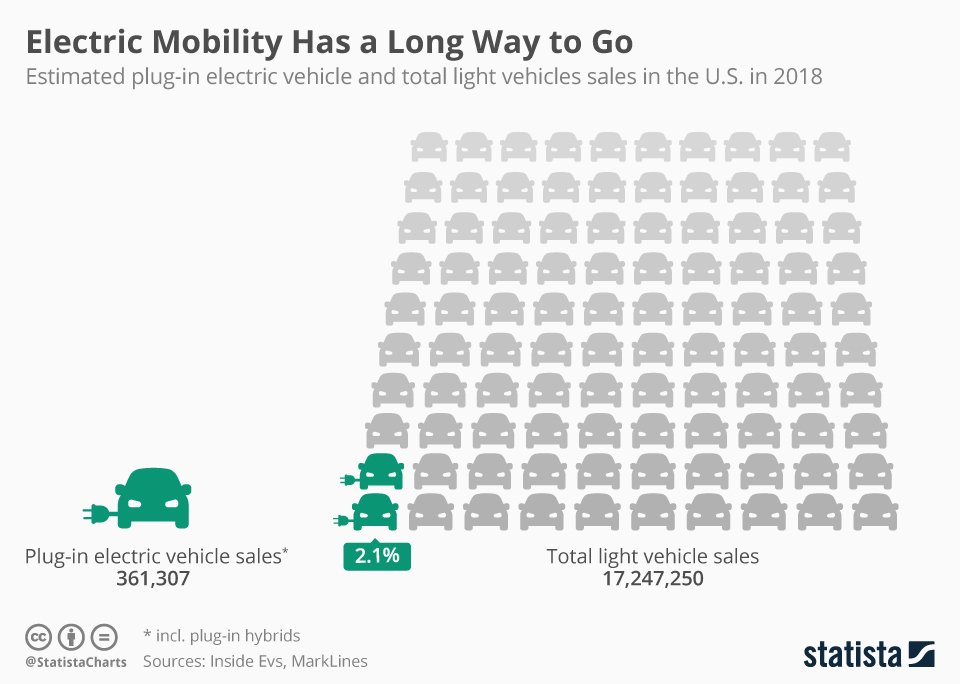
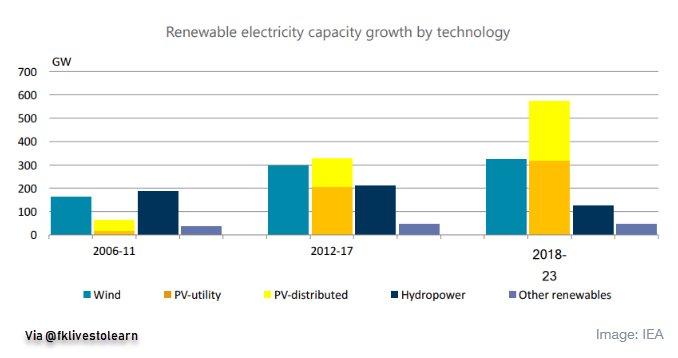
- General Purpose, Renewables, Sustainability etc.
1
⟫⟫⟫⟫⟫⟫⟫⟫⟫⟫⟫⟫⟫⟫⟫⟫⟫⟫⟫⟫⟫⟫
2
⟫⟫⟫⟫⟫⟫⟫⟫⟫⟫⟫⟫⟫⟫⟫⟫⟫⟫⟫⟫⟫⟫

3
⟫⟫⟫⟫⟫⟫⟫⟫⟫⟫⟫⟫⟫⟫⟫⟫⟫⟫⟫⟫⟫⟫

4
⟫⟫⟫⟫⟫⟫⟫⟫⟫⟫⟫⟫⟫⟫⟫⟫⟫⟫⟫⟫⟫⟫

5
⟫⟫⟫⟫⟫⟫⟫⟫⟫⟫⟫⟫⟫⟫⟫⟫⟫⟫⟫⟫⟫⟫

6
⟫⟫⟫⟫⟫⟫⟫⟫⟫⟫⟫⟫⟫⟫⟫⟫⟫⟫⟫⟫⟫⟫
Email?| Twitter? | LinkedIn?| StockTwits? | Telegram?